Test charts are created once the paper properties have been checked. A test chart is a grayscale surface made up of the 4 process colors. The grayscale surface should cover the paper size as far as possible. For an XL105, we create a surface of 1000 mm x 700 mm, for example.
We need two test charts for each plate size. Set up the test charts for the front and the back respectively. This makes it easier to identify them at a later time.
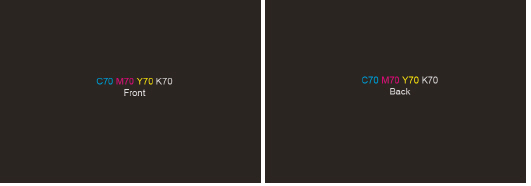
1. Test chart: 70% area coverage for low grammage paper
The first test chart needed has an area coverage of 70% (Cyan 70%, Magenta 70%, Yellow 70%, Black 70%). This surface is later printed on the paper with the lowest grammage. Its purpose it to create the greatest possible misregistration.
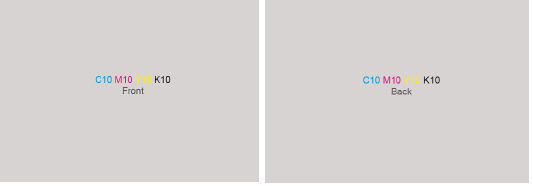
2. Test chart: 10% area coverage for high grammage paper
The second test chart needed has an area coverage of 10% (Cyan 10%, Magenta 10%, Yellow 10%, Black 10%). This surface is later printed on the paper with the highest grammage. Its purpose it to create the smallest possible misregistration.
Result
After creation, there are two 2-page PDFs. The first PDF with 10% area coverage, the second PDF with 70% area coverage.
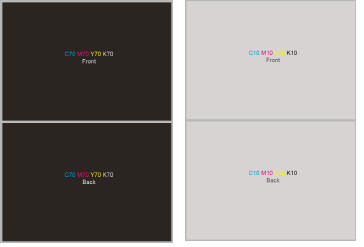
Left: 2-page PDF with 70% area coverage. Right: 2-page PDF with 10% area coverage.