Assess the Quality of a Characteristic Curve
To obtain optimum results with a characteristic curve, quality is essential when creating the curve. In the Characteristic Curve Editor, the quality can be assessed visually and also by way of percentage values.
The assessment is vital above all if the characteristic curve is made up of more than 2 jobs (e.g. if a real production job is included in the calculations next to the test jobs). You can also edit existing characteristic curves and compare their values (if measurement data sets are added or deselected, for example).
Proceed as follows to assess the quality of a characteristic curve:
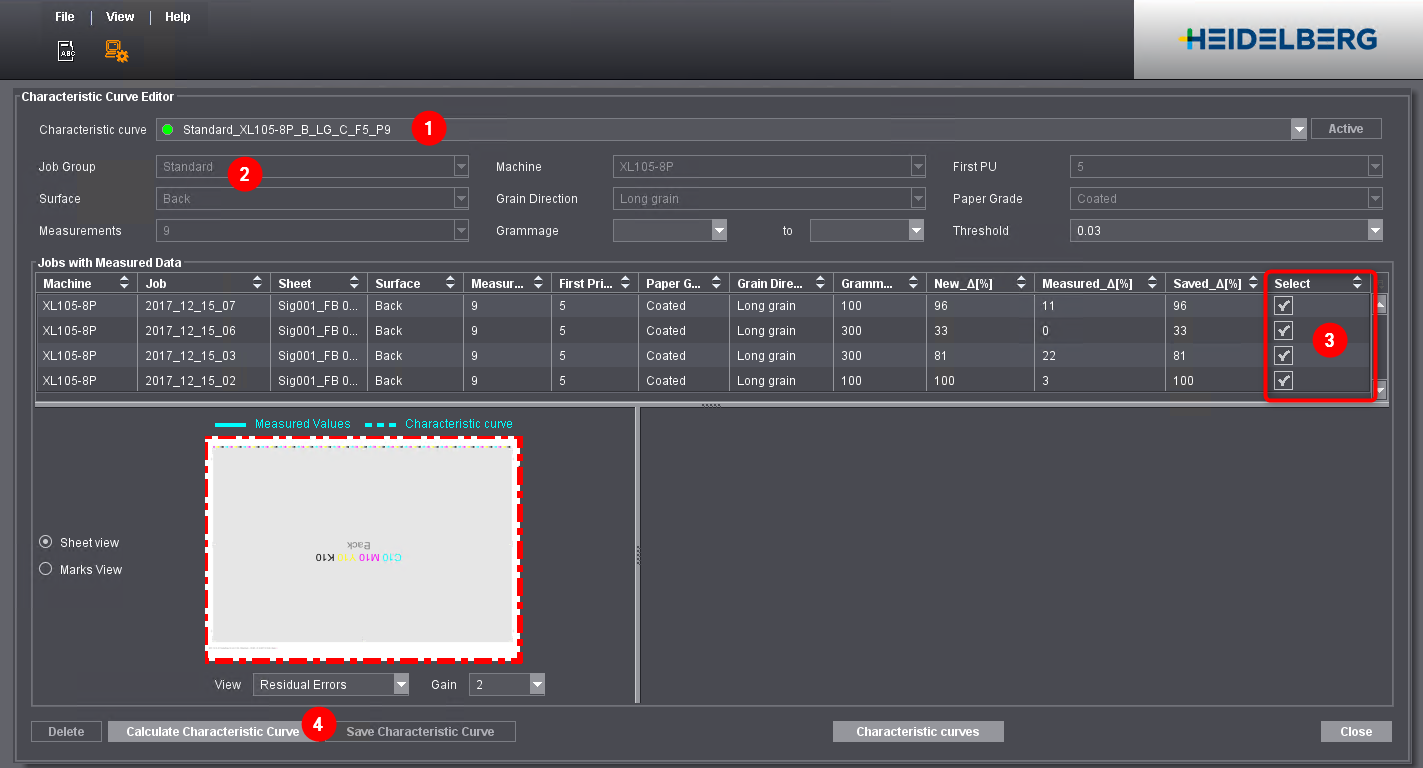
1.Go to the "Characteristic Curve Editor".
2.Select one of the following options in the "Characteristic curve" list box (1):
·"New characteristic curve"
Choose this option if you want to create and assess a new characteristic curve.
·An existing characteristic curve
Choose an existing characteristic curve if you want to edit it and compare the qualities before and after editing.
(3).Choose a job group (only required for the option "New characteristic curve") (2).
4.In the "Jobs with Measured Data" list box, select all the measured data sets to be included in the characteristic curve.
To do so, checkmark the "Select" column (3).
5.Click "Calculate Characteristic Curve" (4).
The characteristic curve is calculated, and you can assess its quality.
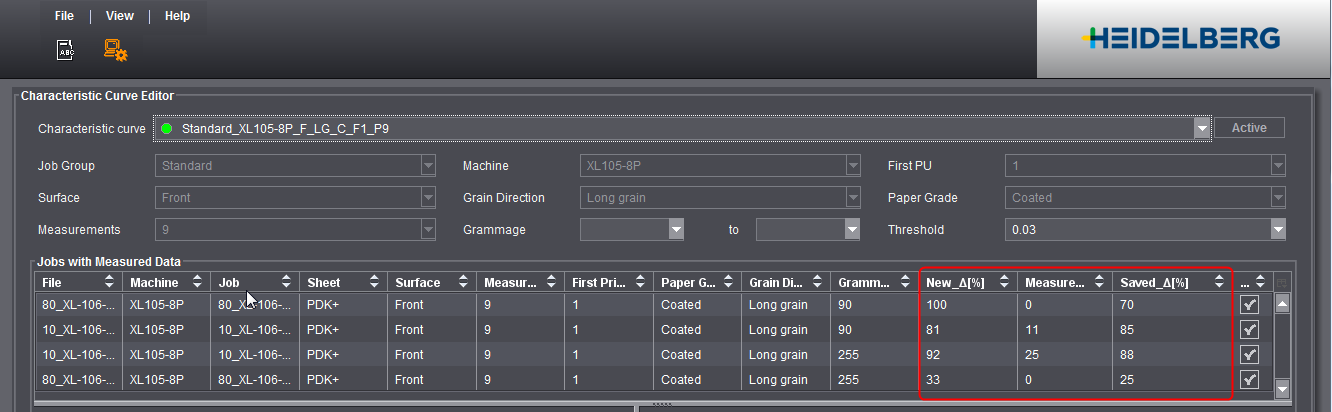
The percentage values in columns "New_Δ", "Measured_Δ" and "Saved_Δ" indicate the misregistration of a job. They specify what percent of the measured data are within the set error tolerance. The error tolerance is set in the "Threshold" list box. A value < 0.03 mm can hardly be perceived by the human eye.
When you are creating a characteristic curve, the Delta values are the best way for you to check the expected compensation.
•Measured_Δ
Indicates the percentage of measured values that are within the error tolerance without compensation.
•New_Δ
Indicates the estimated percentage of measured values that are within the error tolerance after compensation with the current characteristic curve. The value is always 100% if only two jobs are selected. For that reason, the value is interesting mainly if more than two jobs are selected. The higher the value is for all selected jobs, the more suited the characteristic curve is for compensation of these jobs.
•Saved_Δ
This column has data only if a characteristic curve already exists for a job. After you select the characteristic curve, the column is filled for all jobs involved. It indicates the estimated percentage of measured values that are within the tolerance after compensation with the saved characteristic curve. You can refer to this value when creating a new characteristic curve and compare it with "New_Δ".
Whenever a characteristic curve is selected or calculated, you can view the expected result of compensation for a selected job.
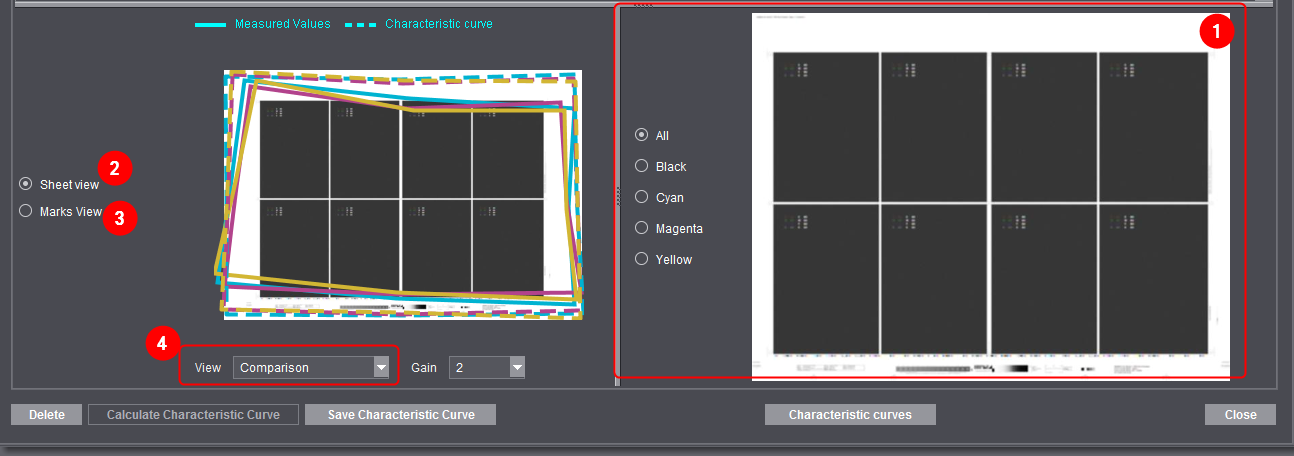
•Thumbnails (1)
The thumbnails give you an overview of the distribution of color on the sheet. You can also select single separations.
•"Sheet view" (2)
It shows the quality of the curve values and measured values found at the mark positions. The error displayed can be exaggerated using the "Gain" list box. This can be shown by separations. Compensation of the characteristic curve is not affected by this.
•"Marks view" (3)
This portrays the measured values at a mark position, shown as sighting disks. The outermost circle shows a threshold of 0.4 mm misregistration. The middle circle 0.2 mm and the inner one 0.1 mm.
•"View" list box (4)
·"Residual Errors"
This displays the expected residual errors after compensation.
·"Measured Values"
This displays the misregistration measured (before compensation).
·"Comparison"
This displays the misregistration measured (before compensation) compared to the expected residual errors after compensation.
·"Characteristic curve values"
This displays the stretching values calculated by Automatic Paper Stretch Compensation. Residual errors subtracted from the misregistration measured result in the stretching values shown in the box.