Principle of Calibration Based on Process Calibration
Please read the information relating to the terms: nominal value, measured value and process value (see the Terms Relating to Dot Gain ).
•When you have a curve with reference values or a process curve: Input values = nominal values
Output values = process values
This curve portrays the desired, i.e. ideal printing process.
•When you have a curve with actual values or a data curve:
Input values = nominal values
Output values = measured values.
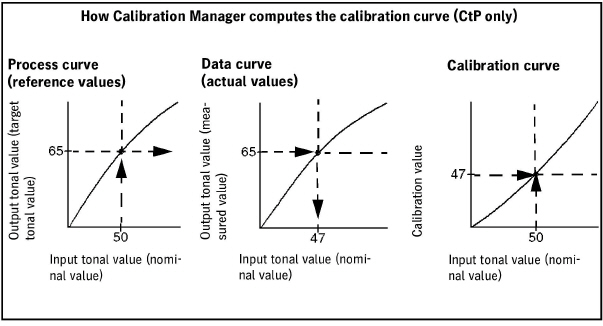
•Calibration curve: this is determined from the process curve and the data curve as follows (see also diagram below):
The actual dot percentage for a nominal value of 50% is to be 65%, for example, according to the process curve. However, this tonal value is not achieved at the nominal value of 50% but at 47% as shown in the data curve. For that reason, the calibration curve assigns the tonal value of 47% to the input tonal value of 50%.
This means that in the input data the input tonal value of 50% is replaced by the tonal value of 47% before screening.
Creation of a calibration curve (process calibration)