"Smooth" Button => Notes on Smoothing
Faulty measured values can cause unwanted outliers in the data curves. These are eliminated when you smooth the data and the original data curve is replaced by the smoothed data curve.
We recommend that you make a backup of your original data before smoothing them!
•"Smooth" button:
·In the Standard Mode, smoothing is based on the spline method.
·In the Expert Mode, dialogs for selecting the smooth method display (see below), and after that you can start smoothing. A green preview of the smooth curve appears beside the original curve.
•"Undo Smooth" button: This button lets you undo a smoothing operation you did.
•Smooth based on the spline method.
•Smoothing is possible once only per color after you open a data record.
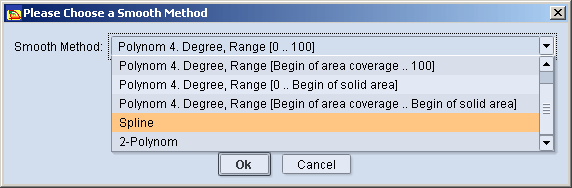
In the Expert Mode, the dialog below displays, allowing you to choose from six smoothing methods:
Explanation of these smoothing methods:
•"Polynom 4. Degree, Range [0 ... 100]" smooths the curve (measuring values) ranging from 0% to 100% (from point 1 to point 4)
•"Polynom 4. Degree, Range [Begin of area coverage ...100]" smooths the curve from the start of dot percentage to 100% (from point 2 to point 4)
•"Polynom 4. Degree, Range [0 ... Begin of solid area]" smooths the curve from 0% to the start of solid area (from point 1 to point 3)
•"Polynom 4. Degree, Range [Begin of area coverage ... Begin of solid area]" smooths the curve between the start of dot percentage to the start of solid area (from point 2 to point 3)
•"Spline": A spline method is applied to smooth the curve
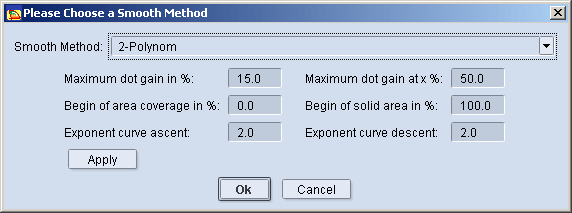
•"2-Polynom": Smoothing is based on a pair of polynomes, whose parameters have to be selected manually:

Which calibration curves will be smoothed?
See Overview of Averaging Data Curves.
The mean curves will be smoothed.
•Case 1 for separate calibration, CMYK:
A mean value is produced from two or three data curves that are to be processed. The resulting mean curve is smoothed for each color (process color or spot color).
•Case 2 for indiscrete calibration, CMYK (CMY):
Only for process colors: All the data curves of all the process colors are averaged. The one mean curve that results from this is smoothed.