Diagram => "Dot Gain" Option: Notes on Dot Gain
Dot gain is the difference between the output tonal value (process value or measured value) and the linear value. Without dot gain, the output tonal value would be identical to the input tonal value; in other words, the measured tonal value would be equivalent to the nominal value.
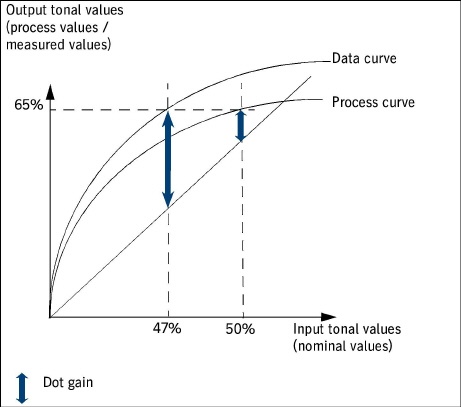
See the diagram below for an example:
•For an nominal value of 50%:
Input value (nominal value) = 50%
=> linear output value = 50%
Process value = 65%
=> dot gain = 65% - 50% = 15%.
This means that at 50% the process is to have a dot gain of 15%.
•For an nominal value of 47%:
Input value (nominal value) = 47%
=> linear output value = 47%
Measured value = 65%
=> dot gain = 65% - 47% = 18%.
This means that at 47% the process shows a dot gain of 18%.
Schematic diagram of the dot gain
On the left, you see a process curve and a data curve above the linear curve (red).
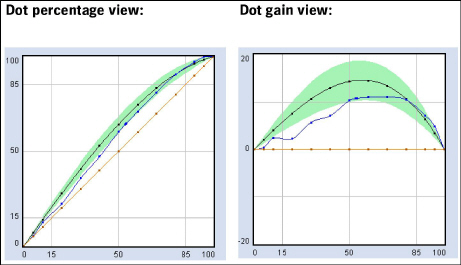
In the dot gain view on the right, the linear curve (red) from the left diagram becomes the zero line (also red).
Graphically, the dot percentage view is tilted effectively by 45° to the right.