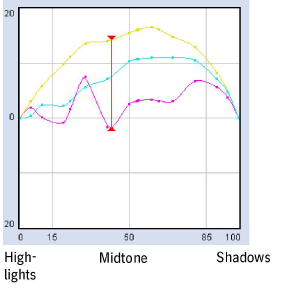
Diagram => Spread as displayed in a graph
Spread is the dot gain difference between CMY.
ISO standard 12647-2 specifies a spread of less than 5% in the midtone. In the diagram below, you see a spread that exceeds this value. The maximum spread is marked by the red line.
You view this diagram with the following settings:
•Dot gain view
•"View" = "Measured Values" (multiple colors)
•"Color(s)" = CMY
•Prerequisite: The process curve set has a curve for CMY for which a spread value is defined.
Spread is important for gray balance. If gray values are made up of CMY, the dot gains of the various colors may not differ too widely as gray can have a color cast if this happens.