
The base linearization characterizes the color reproduction properties of a printer. During base linearization, a printer-specific linearization file (.epl file) is generated. At the same time, an IT8 template file for the used paper is generated that can serve as basis for calculating a paper color profile (.ICC file) in a suitable software (e.g. Prinect Color Toolbox). With the combination of these two file types a color-consistent print output can be ensured.
Prerequisite: The following requirements must be met:
·Measuring device: to linearize a printer, a measuring device must be present. Some printers feature an integrated measuring device (see Creating a Base Linearization with an Integrated Measuring Device).
·Software for profile generation: You need an appropriate software such as "Heidelberg Prinect Color Toolbox" to calculate and generate profiles. You may have to separately purchase a suitable software if it is not part of your Prinect configuration.

Note: Please heed the following when configuring the printer linearization:
·The measurement data (IT8) intended for calculating an ICC profile with Color Toolbox is stored in folder "C:\ProgramData\Heidelberg\Color Proof Pro\Client\Working" in a respective separate subfolder.
·Some printers must be set up so that the "paper set" defined here exactly matches the printer settings, e.g. HP Zx100 family, Epson Stylus Pro x880 family and Canon iPF5 family.
In the sections to follow, we explain how to create a base linearization and paper profiles in two examples:
•Creating a Base Linearization with an External Measuring Device
•Creating a Base Linearization with an Integrated Measuring Device
Creating a Base Linearization with an External Measuring Device

Prerequisite: The used printer must have been set up completely in the Color Proof Pro "Printer settings" module (see Setting Up Printers and Installing Profiles).
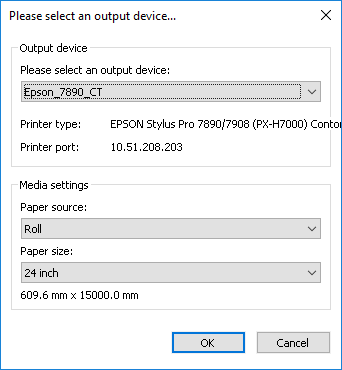
1.On the start page, click "Create Base Linearization". The dialog "Please select an output device" opens:

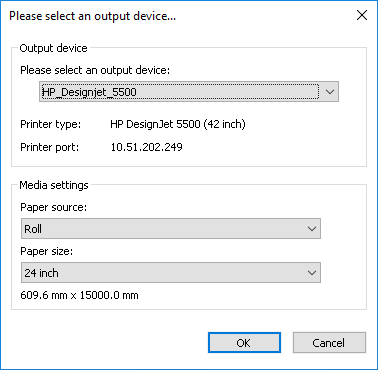
Select the printer, the paper source and the paper size and confirm with "OK".
The "Settings" view displays:

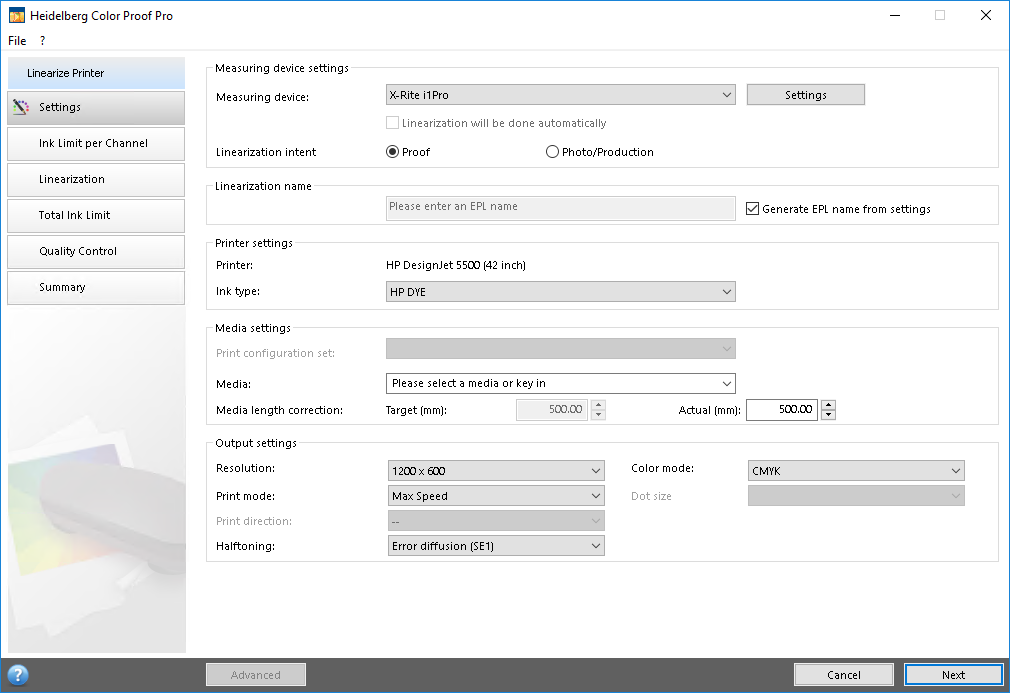
2.Select the measuring device.
In our example, we use the "X-Rite i1Pro" measuring device.

Note: You can configure the measuring device with the "Settings" button if this button is enabled. The available parameters depend on the measuring device used. When, for example, an "EFI ES 2000" measuring device is used, you can choose from three measurement types:
·M0: The UV portion of the object lighting is not defined. Measurement is done in a single step.
·M1: The UV portion of the object lighting is defined as "D50". Measurement is done in two steps. This option is suited, for example, for papers without optical whiteners.
·M2: With this setting, the spectral power distribution of the object lighting is cut to a wavelength of 420 nm to 700 nm (by light filtering). There is no noteworthy radiation power below 400 nm (UV light). This mode is also referred to as "UV cut". Measurement is done in two steps. This option is suited for papers with optical whiteners, in particular if they are viewed under light sources containing no UV portion. In Europe, non-UV color data is used predominantly for proofing.
In "Linearization intent", you specify the type of print output to be used with the respective linearization profile later:
·Proof: Linearization and paper profile are optimized for proofing, i.e. the base linearization is generated to obtain as precise a color reproduction as possible. In a later step, this option lets you select a reference profile for optimum adaption to the offset printing process. In this case, the color target values are taken from the reference profile.
This linearization intent is intended for operating the printer as color-consistent proofer and should always be selected for proofing.
·Photo/Production: the base linearization is optimized for the reproduction of photographs, i.e. it is created to give a color reproduction maintaining the perceptible impression of the original as far as possible. In this context, maintaining the relative color relations has priority while a precise colorimetric color reproduction is neglected. With this intent, a simulation (reference) profile cannot be selected later. Here, the optimum saturation is calculated from the largest possible tonal range by adding lighter ink earlier and in greater amounts to the solid areas.
This linearization intent is intended for application of the printer as production output device — e.g. for printing pictures — and not as proofer device.
3.In "Linearization name", you can specify a name for the base linearization file (EPL file).
This box cannot edited if the "Generate EPL name from settings" option is enabled. In this case, the name is automatically generated from the parameters "printer model", "resolution", "paper type" and "ink type".
4.In "Printer settings", you can select the ink for the profile for printers supporting different ink types.
5.In "Medium settings", you specify the properties of the used print medium.
In "Print configuration set", you select the paper type best matching the loaded paper type.
In "Media", you must select an item (if present) or type a custom name for the print medium. This name will then appear in the Cockpit in the Proof sequence templates. We recommend specifying the paper name given on the paper package.
If necessary, you can determine the media length correction (see Determine and Set Media Length Correction).
This lets you compensate differences in length feed of printers depending on the print medium used. Enter the result in the "Actual" box. It is written to the EPL file, resulting in the printout always having the same length on different media.
6.In "Output settings", you can set the following parameters:
"Resolution"
The "Resolution" list box offers the resolutions also offered in Prinect Cockpit. Higher resolutions result in a better output quality but also require longer calculation and output times. As a rule, lower resolutions such as 360 x 360 dpi are sufficient for the base linearization.
"Print mode"
The print mode defines the quality of the output — high quality or draft. The print mode depends on the respective printer. Only print modes compatible with the selected printer resolution are offered.
"Print direction"
Bidirectional printing is faster because the printhead prints in both directions. But unidirectional printing yields more precise results. Not all printers support bidirectional printing.
The manufacturers of halftone printers enable halftoning by default.
You can choose between "Error diffusion (SE1)" and "Stochastic screening (SE2)" for printers using one of the halftoning methods supported by Color Proof Pro. For top quality, we recommend SE1, for increased speed, we recommend SE2.
Choose a color mode compatible with your printer:
·Multicolor
If the printer supports light inks such as CMYKcm or additional inks such as CMYKOG, choose a color mode comprising these inks.
There are advanced settings for color modes comprising light inks. Click "Advanced" to specify the percentage of light ink to be added to the solid at 100% of the respective standard ink. We recommend changing the default settings only if really needed.
The ratio between light and standard inks depends on the printer. Adding 5% of light ink can prevent white stripes (banding) to occur on the print output on some printers.
Click "Close" to return to the "Settings" window.
·CMYK
Choose "CMYK" if your printer has only four colors or if you want to integrate a screened file into the base linearization.
"CMYK" is selected by default if the printer uses the printer manufacturer's original halftoning. In this case, a total ink limitation of usually 400% is already integrated into the media type. You can only edit CMYK ink curves although all available inks of the printer are considered.
Dot size

Note: Information on screening methods: Frequency-modulated screens are used for ink jet printers. They are made up of tiny, fine dots. The frequency of the set dots defines the tonal value. Dithering determines the pattern these dots follow. Each of the different screening methods aims at distributing the screen dots as uniformly as possible.
·Superenhanced — Error diffusion
The adjacent dots are also taken into account in the decision whether a dot will be imaged or not. Using a certain algorithm, the adjacent dots provide the basis for determining whether or not the resulting value is above or below a particular threshold and thus is imaged or not. This method involves quite a lot of time-consuming calculation.
·Superenhanced 2 - Random screening
The dots are arranged more or less at random. Homogeneous areas are to be as smooth as possible, but are often less so compared to superenhanced.
Button "Advanced" (this option is only enabled for printers that have special inks)
Click "Advanced" if you want to specify the dot gain for special inks (e.g. Light inks). The following window displays:

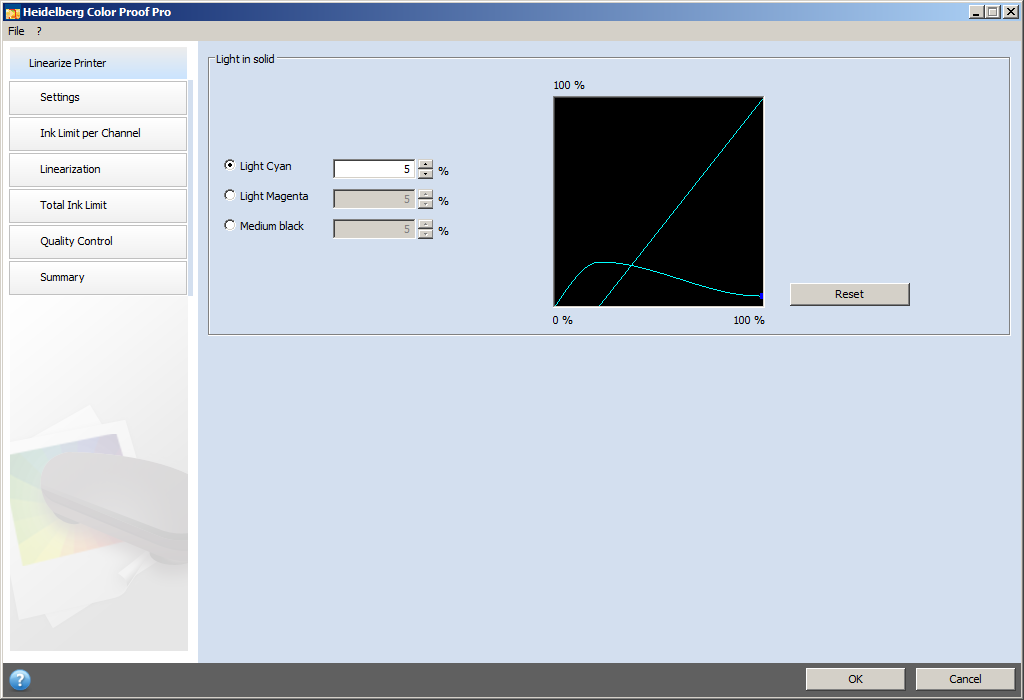

Note: Changes to this area should be made by experienced users only.
In this window you can change the starting point for standard inks. You need this function in the following cases:
·if there is banding in the printed output,
·if there is mottling in the midtones,
·if the percentage of standard Cyan ink in skintones is too high.
Confirm the dialog with "OK" when you are finished. The window closes and the previous view appears.
7.Click "Next".
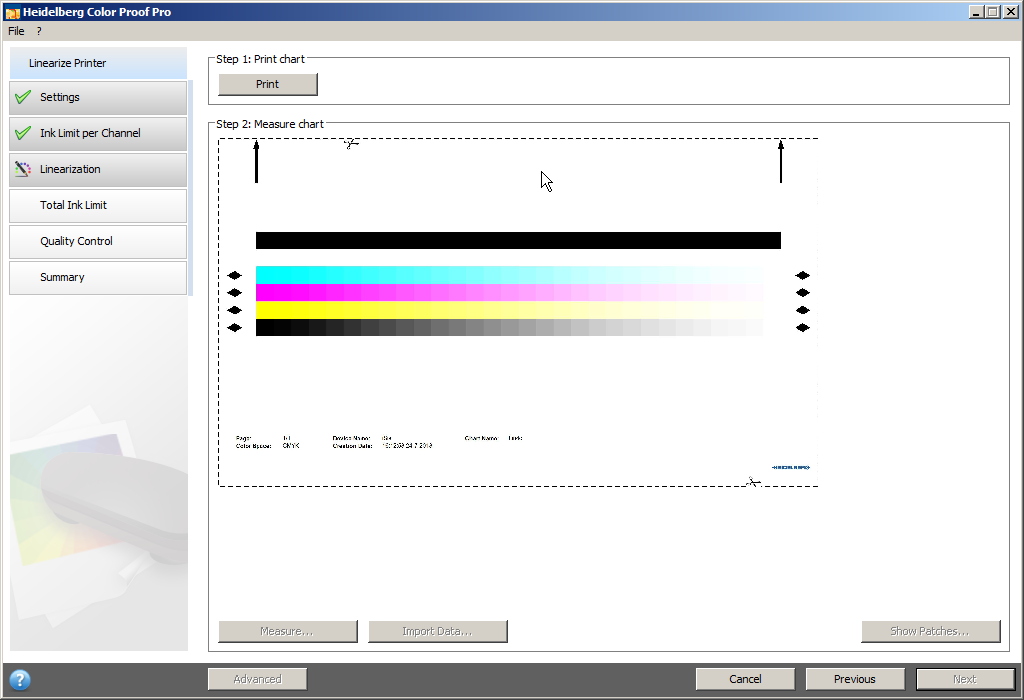
The "Ink Limit per Channel" view opens.

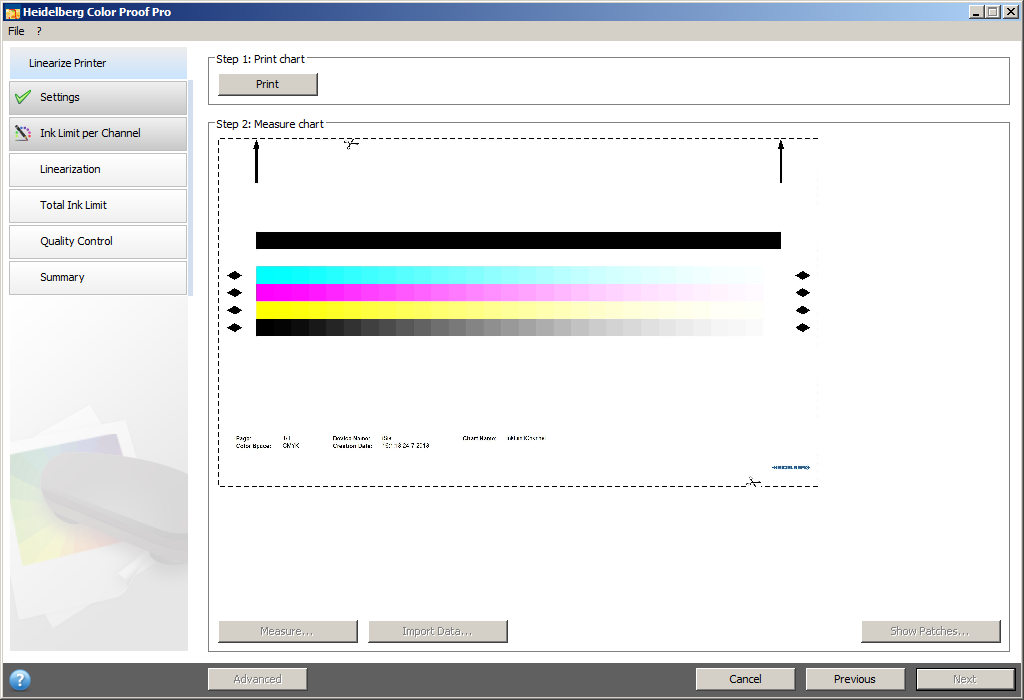
8.Click "Print".
The test chart is printed.
9.Remove the printed test chart from the printer and wait for the ink to dry. Cut the test chart along the dashed lines.
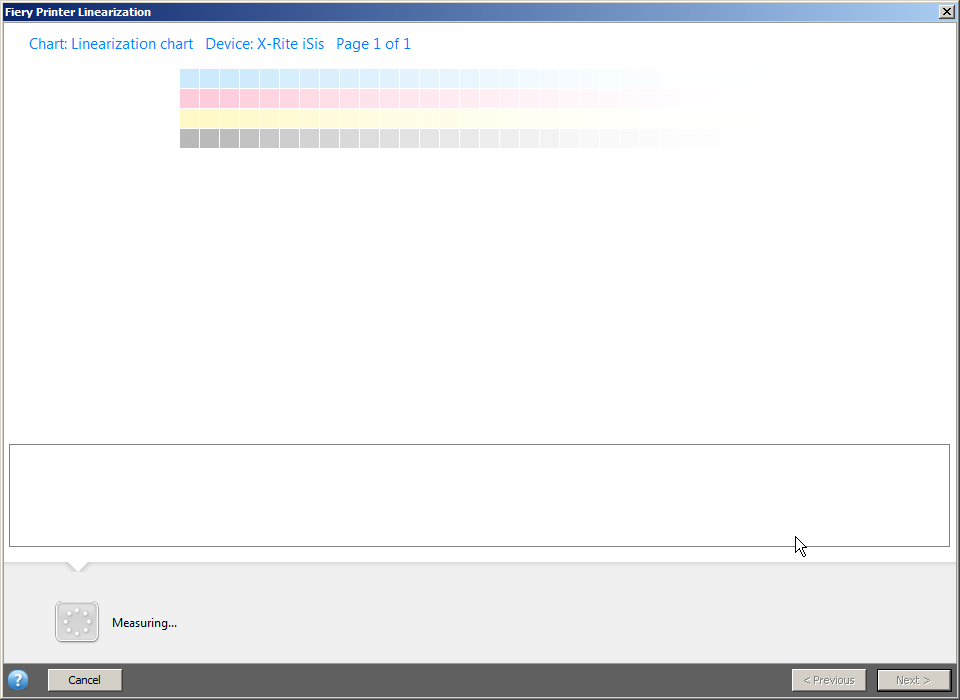
10.Then click "Measure" and load the test chart into the measuring device. To do so, follow the instructions on the screen. The following displays when measuring starts:

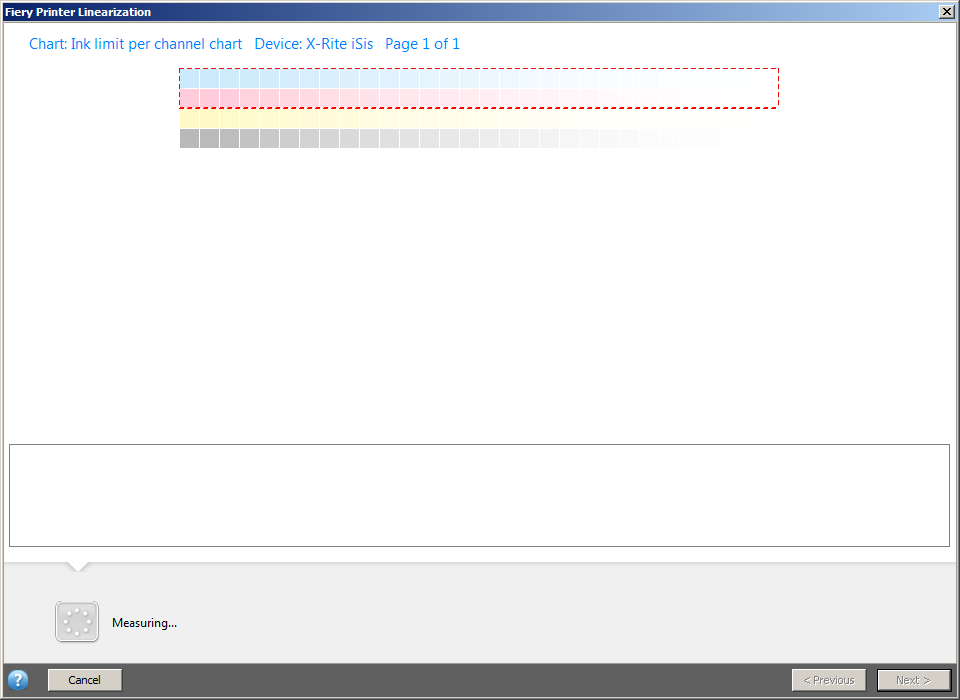
Wait for the measurement to complete. The device used in our example measures automatically which means that further action is not required. You may have to manually perform further steps if using another device. Follow the instructions on the screen.
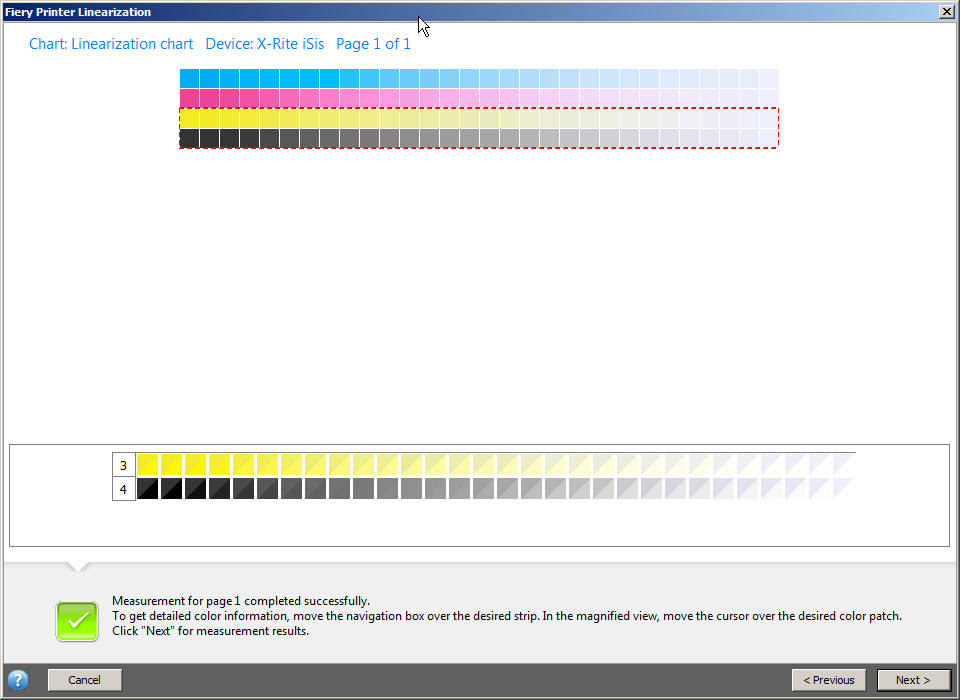
The following view displays if measuring is completed:

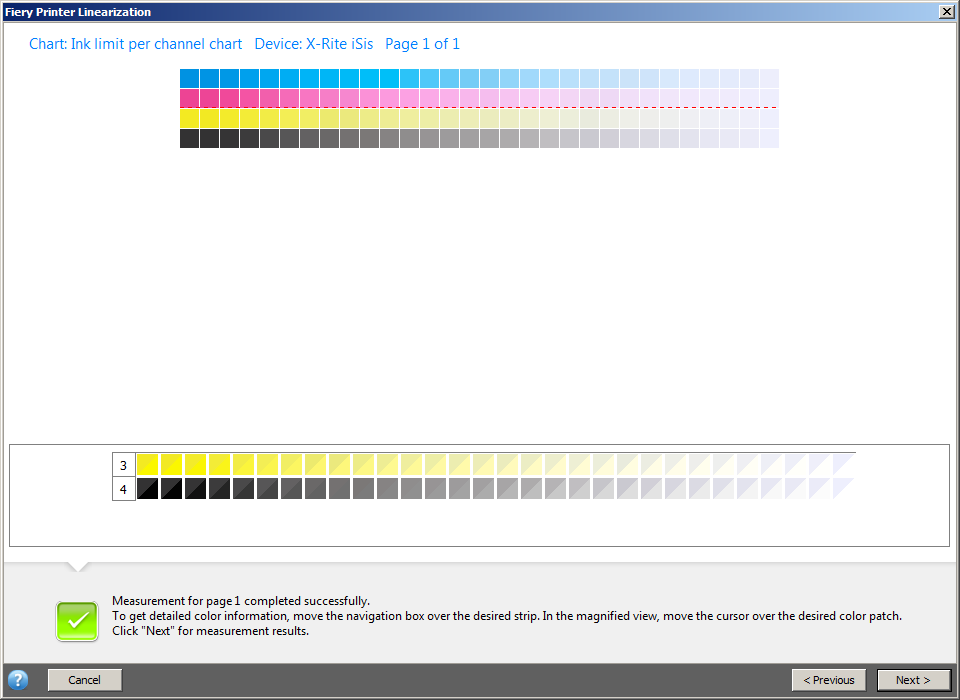
Click "Next". This will return you to the "Ink Limit per Channel" view.

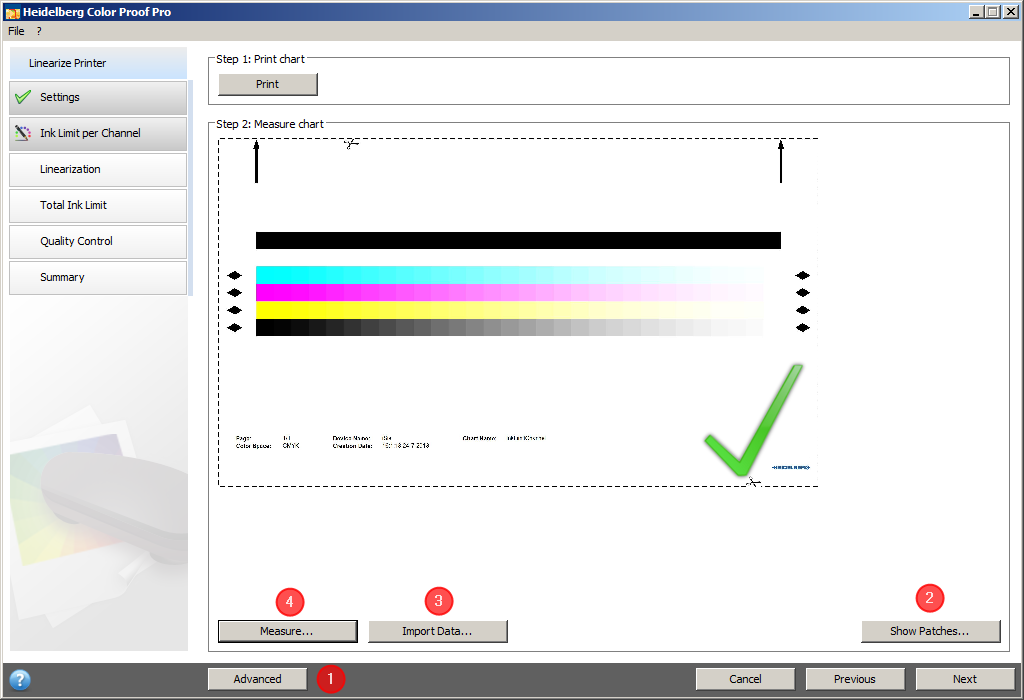
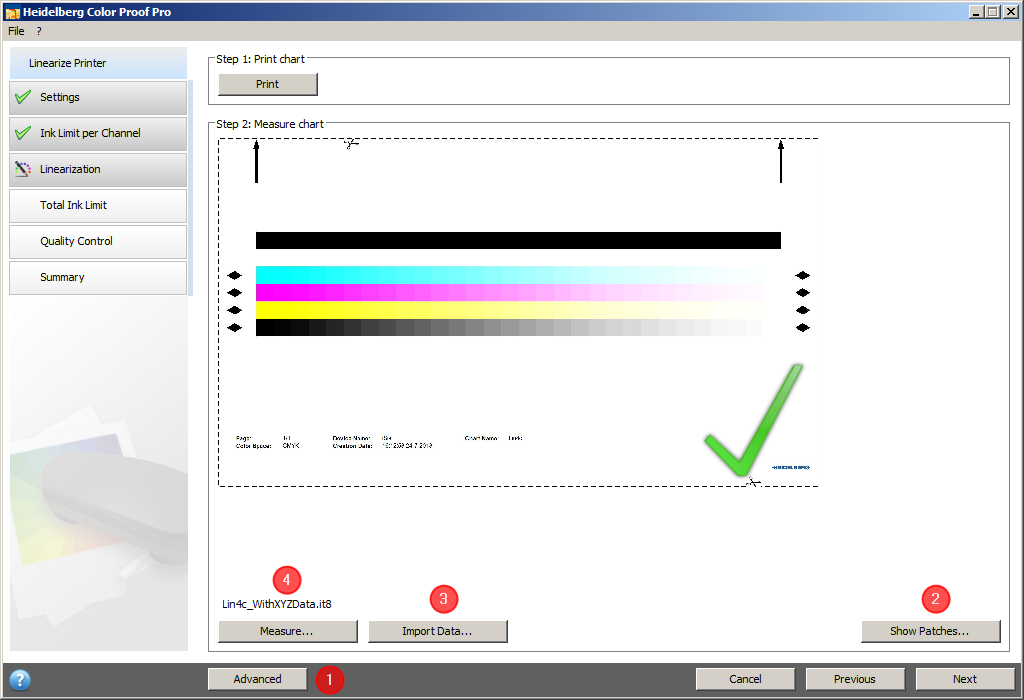
11.You can now do one of the following:
•Click "Advanced" (1) to check the ink limit for each of the channels:

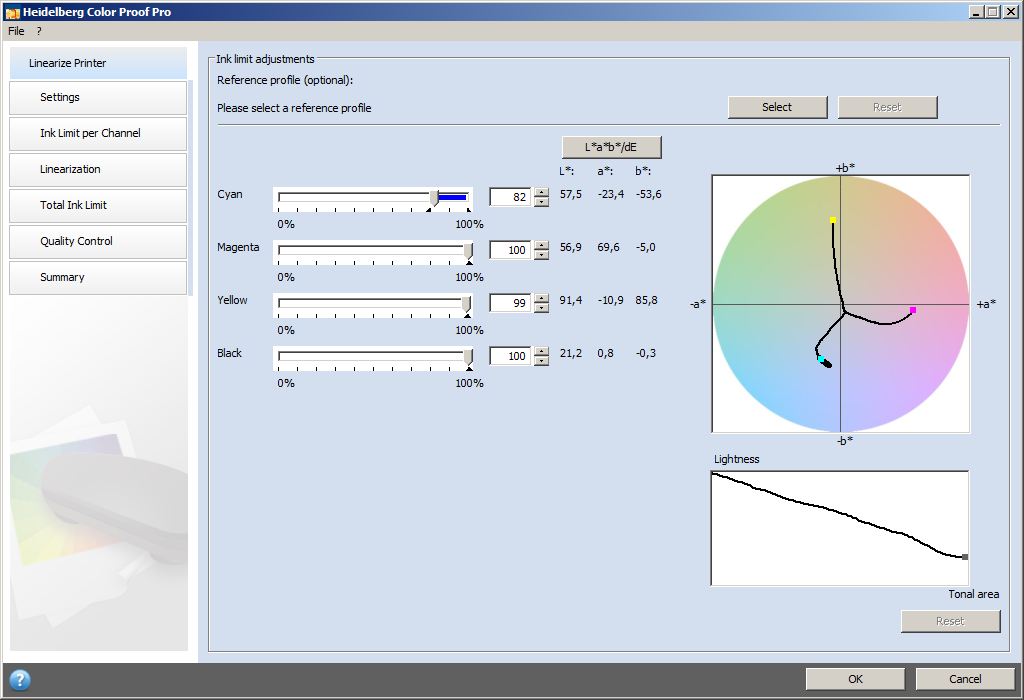
•You can make the following settings in this window:
·You can check whether the recommended ink limits are within the optimum range. The optimum range is shown in blue. Move the slider as required.
·Click "Select" to load a simulation profile (reference profile) if necessary. This will ensure the ink limits are taken from the reference profile. Select either a standard simulation profile or a profile exactly matched to the offset printing process usually provided by your print shop.
Selecting a reference profile restricts the available color space. This will ensure your custom media profile optimally matches the reference profile. A suitable industry standard will be applied if you do not select a profile.

Caution: With too much ink, the density is no longer increased but the hue changed.
Click "OK" to return to the "Ink Limit per Channel" window.


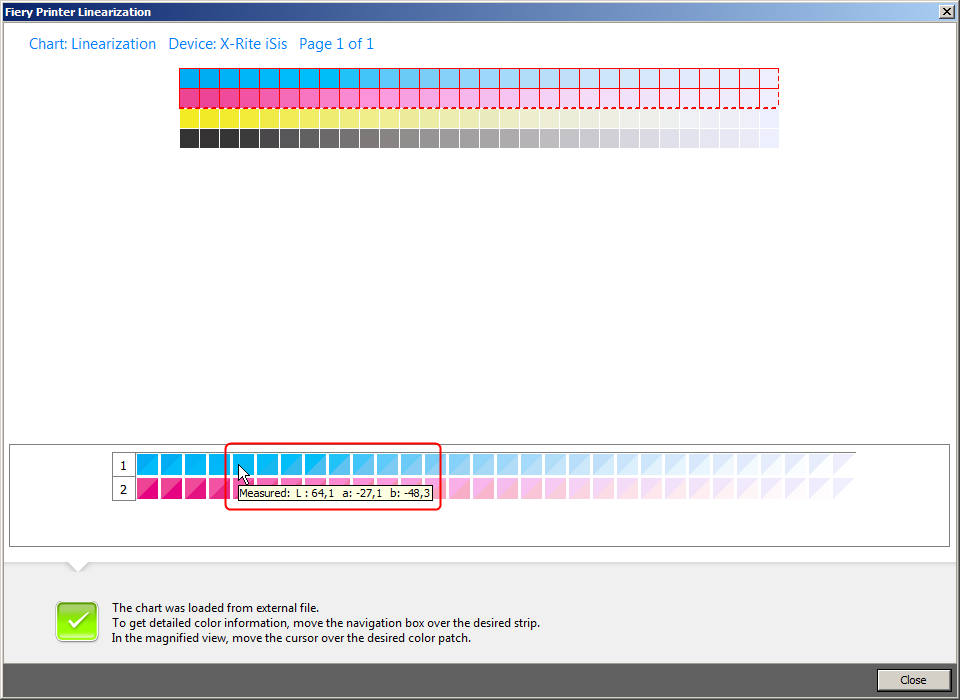
•To show a picture of the test chart used for measuring, click "Show Patches" (2):


You can select two rows of patches each in the upper part of the window. They appear separately in the bottom part.
When you hover the mouse pointer over a color patch, the L*a*b value of the respective color patch is shown in a tooltip.
Click "Close" to close the window again.


•Clicking "Import Data" (3) lets you import an IT8 file generated by an external measurement.
•Click "Measure" (4) to measure the test chart again.
12.Click "Next" if you have completed all actions you wanted to perform in the "Ink Limit per Channel" view.
The "Linearization" view opens.

13.Click "Print".
The test chart is printed.
14.Remove the printed test chart from the printer and wait for the ink to dry. Cut the test chart along the dashed lines.
15.Then click "Measure" and load the test chart into the measuring device. To do so, follow the instructions on the screen. The following displays when measuring starts:

Wait for the measurement to complete. The device used in our example measures automatically which means that further action is not required. You may have to manually perform further steps if using another device. Follow the instructions on the screen.
The following view displays if measuring is completed:

Click "Next". This will return you to the "Linearization" view.


16.You can now do one of the following:
•Click "Advanced" (1) to check the linearization for each of the channels:

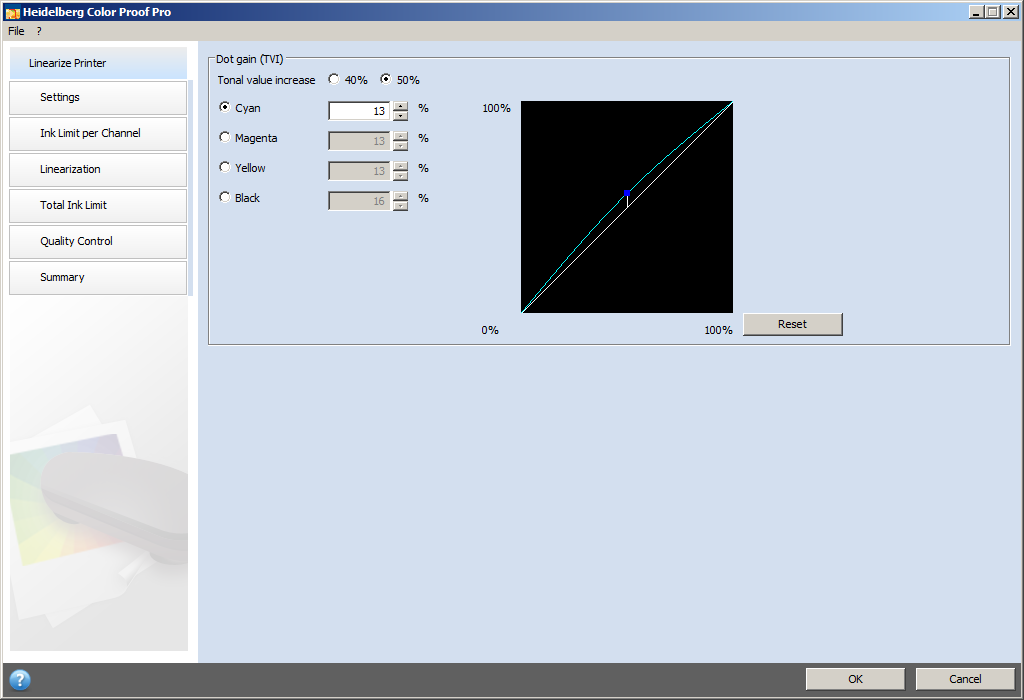
•In this window you can check the start point of the standard inks and the dot gain (tonal value increase=TVI) and adjust them if necessary.
Usually, the standard values will yield good results because a special algorithm takes care of calculating the correct ratio of Light and standard inks and a dynamic dot gain is taken into account. Please heed the following if you still need to make changes:
The ideal start point for standard inks depends on the respective combination of print medium, ink and resolution. For newspaper printing, we recommend setting the percentage of Light inks to a minimum to prevent applying too much ink on the print medium. But this could result in a grainy print because larger dots are printed in highlight areas. But when printing on proof or photo media, a higher percentage of Light ink is used to give a more uniform color impression.
But the overall ink limit is equally important. The maximum value per ink channel is 100%. If, for example, the printer supports CMYK inks, the maximum overall ink limit is 400%.
The "Dot gain (TVI)" parameter specifies the percentage of the color to which the dot gain is applied. The dot gain describes the difference between the dot size on the (offset) printing plate and the corresponding dot size on the printed (paper) sheet. Experience has shown that the dot gain should also be taken into account for inkjet printers. In Europe, the dot gain has always been defined with 40% of the basis value for the gradation curve. In other countries such as the US and the Pacific, a dot gain of 50% is assumed.
Click "OK" to return to the "Ink Limit per Channel" window.

•To show a picture of the test chart used for measuring, click "Show Patches" (2):

You can select two rows of patches each in the upper part of the window. They appear separately in the bottom part.
When you hover the mouse pointer over a color patch, the L*a*b value of the respective color patch is shown in a tooltip.
Click "Close" to close the window again.


•Clicking "Import Data" (3) lets you import an IT8 file generated by an external measurement.
•Click "Measure" (4) to measure the test chart again.
17.Click "Next" if you have completed all actions you wanted to perform in the "Linearization" view.
The "Total Ink Limit" " window displays.

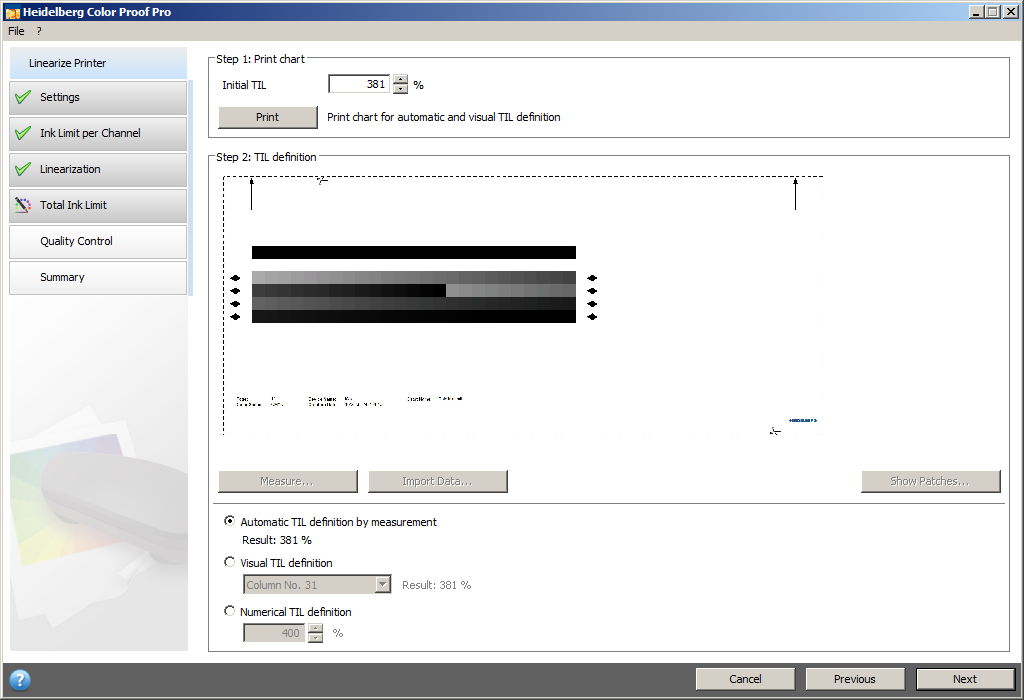
18.Click "Print".
The test chart is printed with the Initial TIL (TIL=total ink limit) being applied. The Initial TIL equals the sum of the ink limits per channel defined beforehand. This is the maximum permissible value. The following rule of thumb applies: the glossier the print medium, the higher is the total ink limit.
19.Then click "Measure" and load the test chart into the measuring device. To do so, follow the instructions on the screen.
Wait for the measurement to complete. The device used in our example measures automatically which means that further action is not required. You may have to manually perform further steps if using another device. Follow the instructions on the screen.
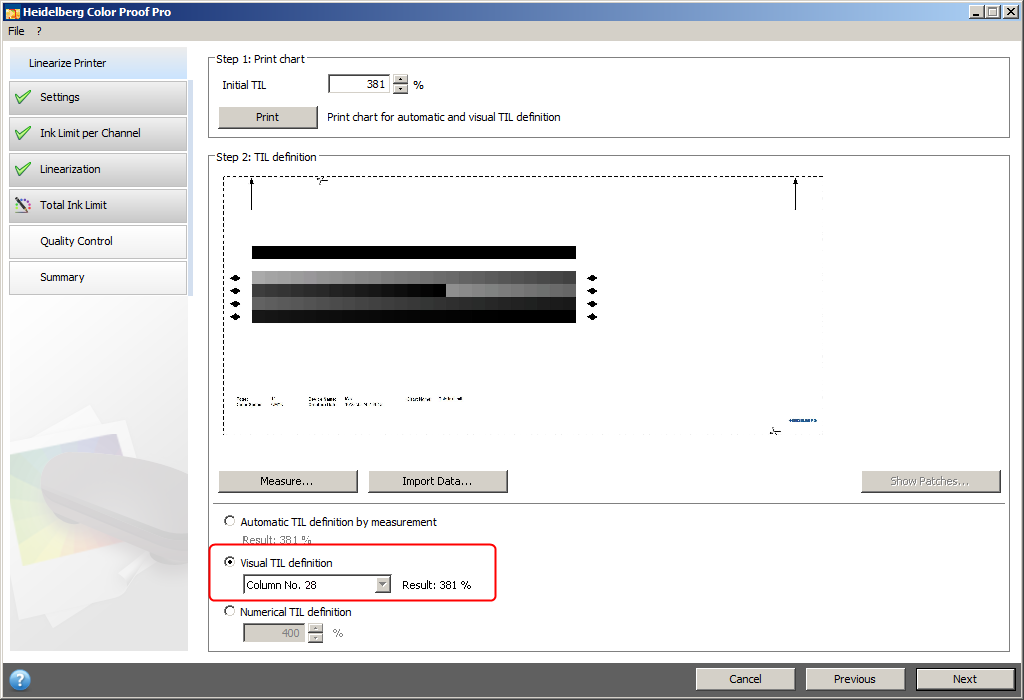
The following view displays if measuring is completed:

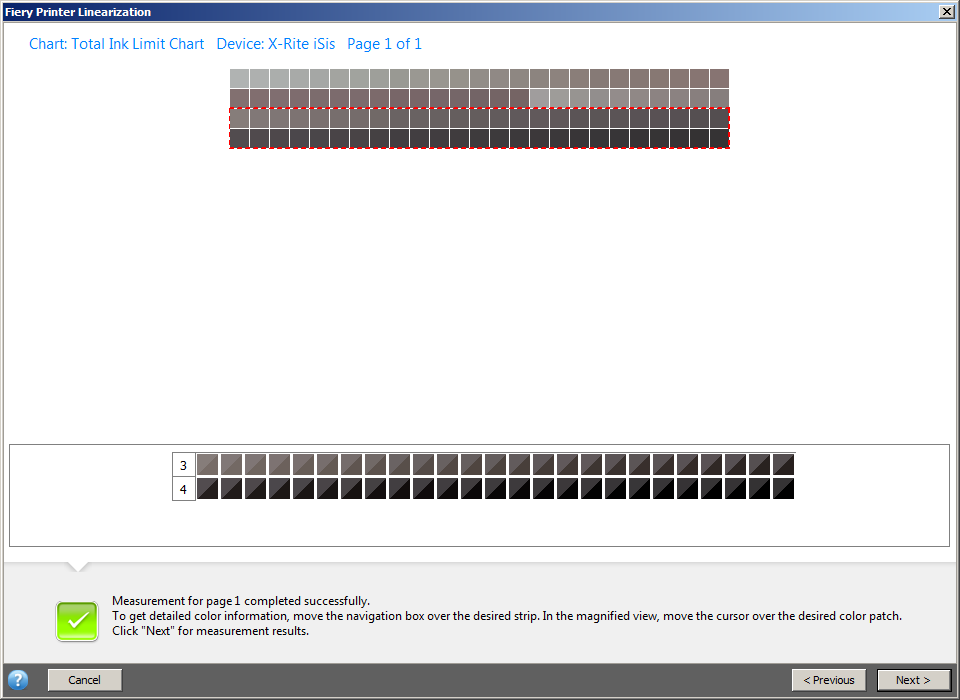
Click "Next". This will return you to the "Total Ink Limit" view.


20.Visually judge the printed Ink Limit per Channel test chart. The ink limit is usually calculated automatically and need not be corrected. Exception: Item 21. and the case described in Notes on Generating a Base Linearization with the "Epson Stylus Pro 7900" Printer in Halftone Mode (e.g. for the Hexachrome Color Space).
21.Redefine the ink limit if the ink dries only slowly or bleeding effects appear. You can define the total ink limit as follows:
·Automatic TIL definition by measurement (1)
After measuring the test chart, Color Proof Pro calculates the optimum total ink limit even if too much ink was printed on the print medium.
·Visual TIL definition (2)
You can gather the total ink limit from the printed test chart. This is helpful if you want to take physical effects such as bleeding or mottling into account. Measuring devices cannot "see" such effects.
a.Print the test chart in the "Total Ink Limit" module:

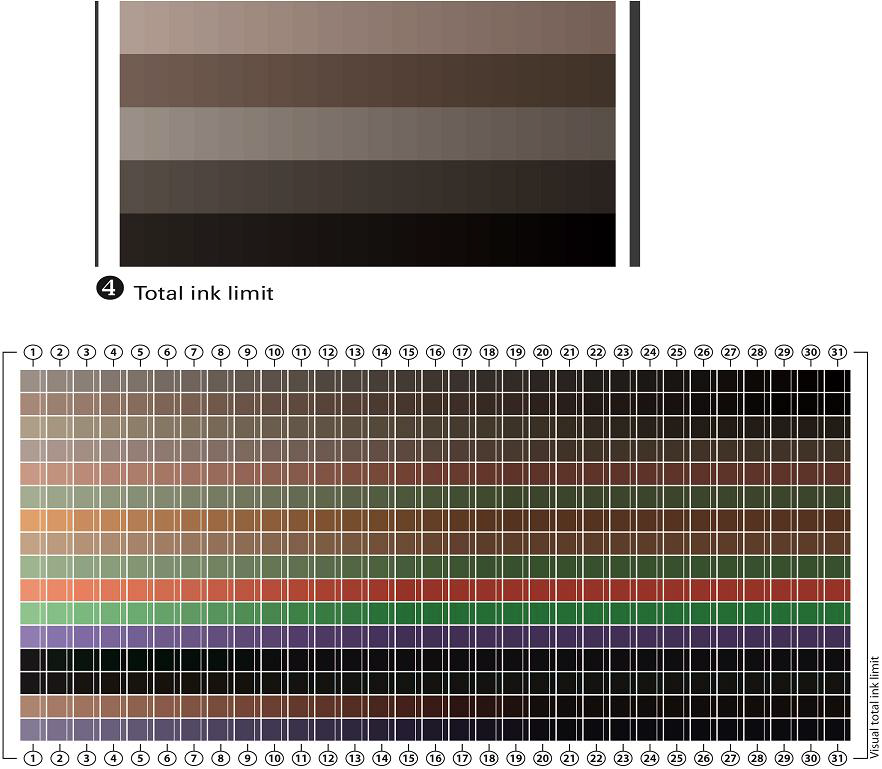
b.In the printed test chart, identify the column where solarization starts (for example, too much ink was applied from column 28 onwards).
c.Enable the option "Visual TIL definition" and select the column number you identified:

No more ink will be applied to the paper from this column onward.
·Numerical TIL definition (3)
If you know the exact total ink limit to apply, you can specify it as a percentage.
The total ink limit defined in this step is saved to the base linearization file.
22.Click "Next".
The "Quality Control" view opens.


23.Click "Print".
The test chart is printed. Check the following in the print:
•Gray balance
Ideally, the black stripe and the CMY stripe should be identical. But it is impossible to obtain a pure black by mixing CMY inks.

Note: To edit the ink limit, return to the "Ink Limit per Channel" module (by clicking the respective button (1) in the left program window area) and click "Advanced".
•Total Ink Limit (TIL)
·Make sure the borders of each of the color patches are clearly defined.
·Make sure the medium does not warp because of too much ink.
·Make sure the ink does not smudge and is uniformly distributed on the medium.

Note: Return to the "Total Ink Limit" module to reduce the total ink limit.
•Transition from Light to standard inks
Examine the stripes of the primary colors and make sure the transition from Light to standard inks is smooth. Smooth transitions are important especially when you are printing skin tones. Speckles appear if standard inks are applied too fast.

Note: To change the start point of standard inks, return to the "Linearization" module and click "Advanced".
24.Wait for the ink to dry. Then click "Measure" and load the test chart into the measuring device. To do so, follow the instructions on the screen.
Wait for the measurement to complete. The device used in our example measures automatically which means that further action is not required. You may have to manually perform further steps if using another device. Follow the instructions on the screen.
The following view displays if measuring is completed:


Click "Next". This will return you to the "Quality Control" view.
25.Click "Next".
A summary of the base linearization is shown:

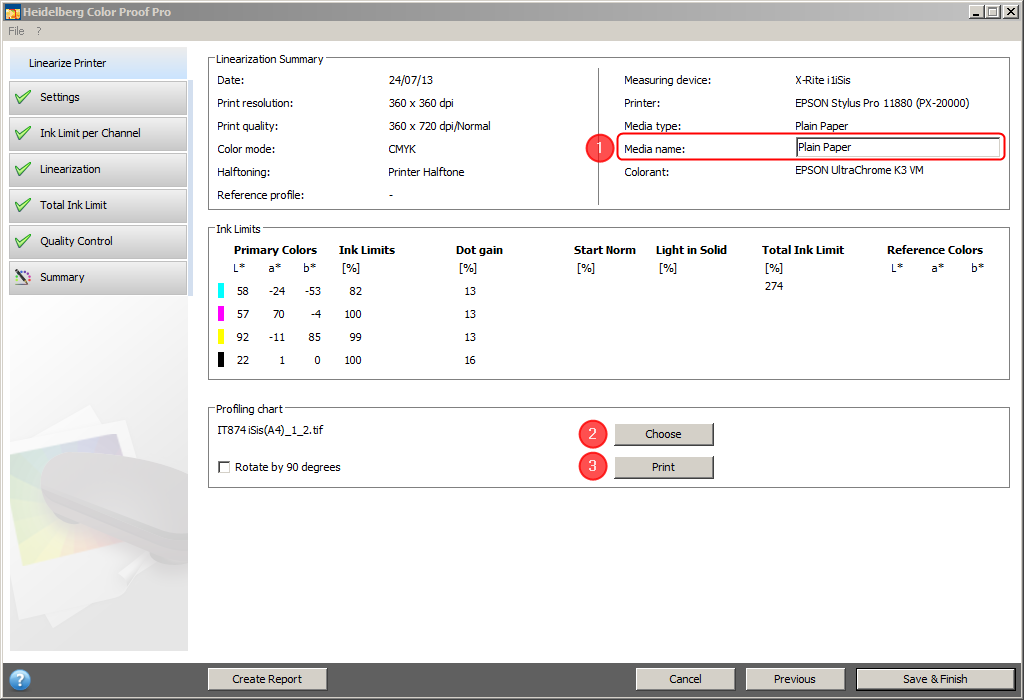
You can edit the name of the print medium (1) before saving the base linearization file.
Group "Profiling chart"
To create a paper profile, for example with the Prinect Color Toolbox software, you must print one or more profiling test charts (see also General Notes on Test Charts). Print the test chart and measure it in Prinect Color Toolbox with the measuring device. The paper profile is then calculated from the measured values and saved as ICC profile file.
26.In "Profiling chart", click "Choose" (1) and select an appropriate chart file, e.g. "IT874 iSis(A4)_1_2.tif".
27.You need not enable the option "Rotate by 90 degrees" because rotation is automatically performed if needed.
28.Click "Print" (2).

Note: You should copy the paper profile file created with Prinect Color Toolbox to the same folder where the linearization file (.epl file) is stored.
You can print a report containing the settings used to create the base linearization file.
A report on the linearization process displays in the standard browser when you click "Create Report":

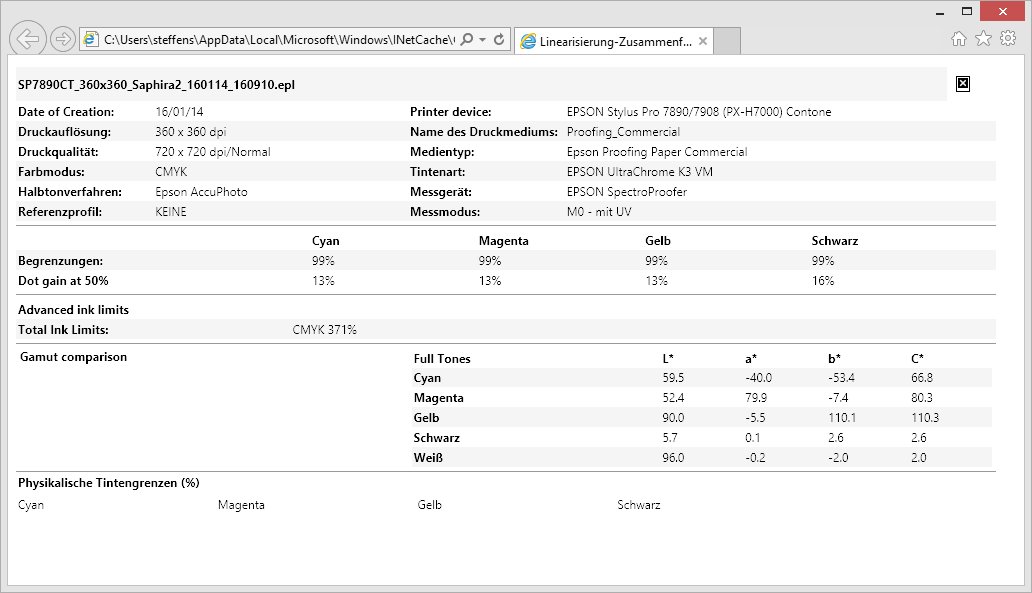
You can print the report using the print functions of the browser.
29.Then click "Save & Finish".
Creating a Base Linearization with an Integrated Measuring Device

Note: The printer used in this example (Epson Stylus Pro 7890) comes with an integrated measuring device. Measuring of the test chart can be done automatically with this printer after the drying time (at least 10 minutes) set in the printer has expired. When using a printer not equipped with a measuring device, you must make sure to keep the recommended ink drying times after having printed a chart (the drying time also depends on the used paper).

Prerequisite: The used printer must have been set up completely in the Color Proof Pro "Printer settings" module (see Setting Up Printers and Installing Profiles).
1.On the start page, click "Create Base Linearization". The dialog "Please select an output device" opens:

Select the printer, the paper source and the paper size and confirm with "OK".
The "Settings" view displays:

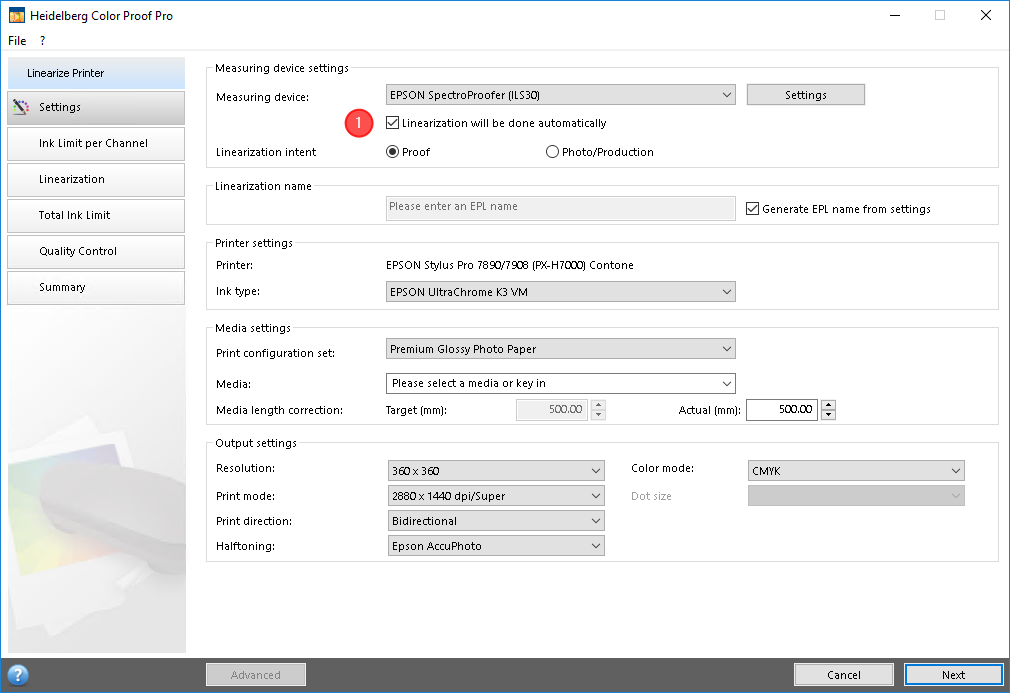
2.Select the measuring device.
In our example, we use the "Epson Spectro Proofer (ILS30)" measuring device. For devices with integrated measuring device, you can enable the option "Linearization will be done automatically". With this option enabled, linearization will be done automatically: when the specified drying time has expired after printing, the test chart is measured automatically.
The following description is based on an automatic measurement. For this reason, enable the "Linearization will be done automatically" (1) option.
3.Make all the settings as described in Creating a Base Linearization with an External Measuring Device.
4.Click "Next".
In the "Ink Limit per Channel" window, you see a preview of the test chart for ink limit per channel.

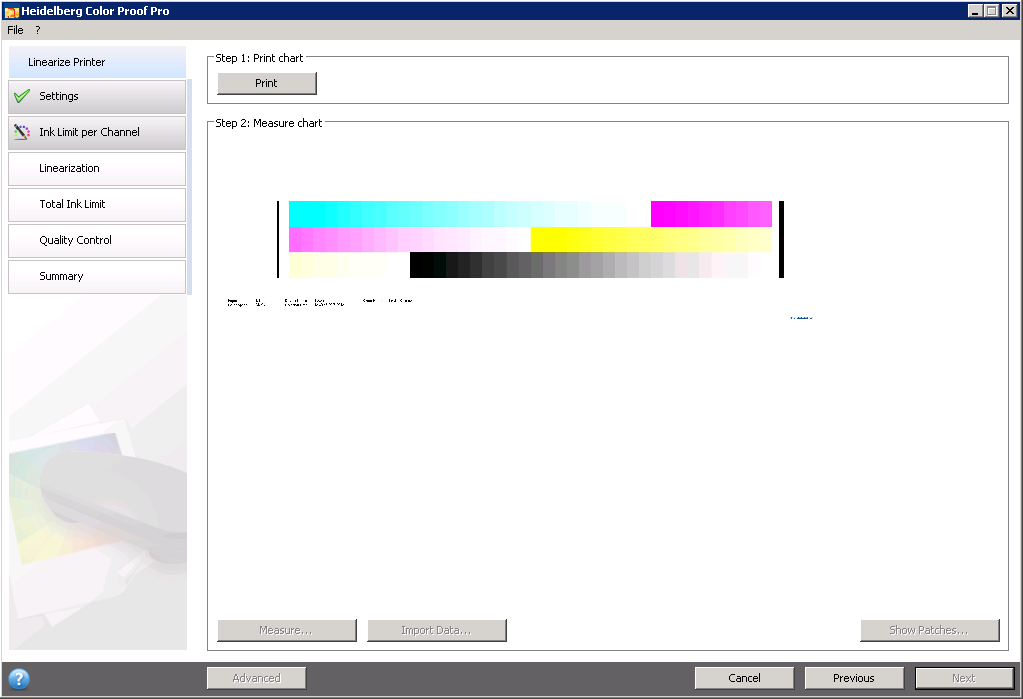
5.Click "Print".
The "Summary" module displays when the automatic linearization is finished:

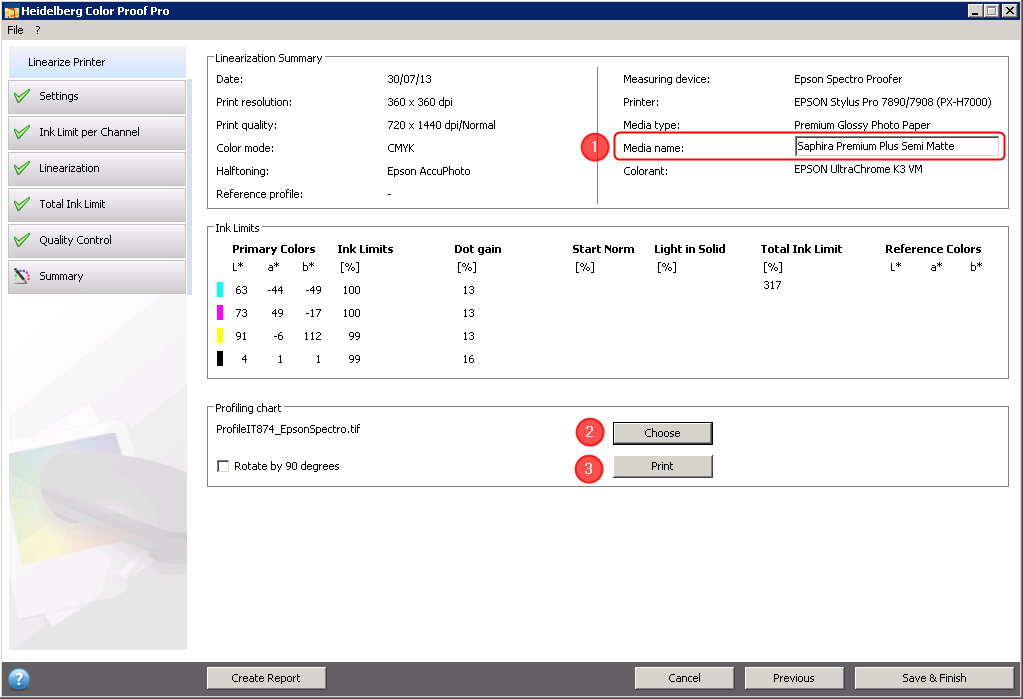
You can edit the name of the print medium (1) before saving the base linearization file.
Group "Profiling chart"
To create a paper profile, for example with the Prinect Color Toolbox software, you must print a "profiling test chart" (see General Notes on Test Charts). The profiling chart consists of several test charts for measuring the ink limit per channel, the linearization, the total ink limit and the quality control.
6.In "Profiling chart", click "Choose" (1) and select an appropriate chart file, e.g. "ProfileIT874_EpsonSpectro.tif".
7.You need not enable the option "Rotate by 90 degrees" because rotation is automatically performed if needed.
8.Click "Print" (2).

Note: This IT8 file for Color Toolbox containing respective measured data is saved to a subfolder of the "Working" folder.

Note: You must copy the paper profile file created with Prinect Color Toolbox to the same folder where the linearization file (.epl file) is stored.
Create report
You can print a report containing the settings used to create the base linearization file.
A report on the linearization process displays in the standard browser when you click "Create Report":


You can print the report using the print functions of the browser.
9.Then click "Save & Finish".
Notes on Generating a Base Linearization with the "Epson Stylus Pro 7900" Printer in Halftone Mode (e.g. for the Hexachrome Color Space)
When performing the base linearization of an Epson printer of the x900 family in the halftone mode, for example necessary for output in the Hexachrome color space, too much ink may be applied on the paper and, as a consequence, ink may spread on the paper in some patches.
As a result, the measuring device cannot correctly determine the spectrophotometric value of such patches. In this case, the color table (IT8 7.4 or ECI 2002) printed after base linearization will not contain correct spectrophotometric values. The outcome: problems during print simulation of ISOcoated_v2, or problems complying with the Fogra tolerances for media wedge v3.
Recommendation
To perform a correct base linearization, you should not enable the automatic mode when an integrated Epson spectrophotometer is present. In other words, leave the "Linearization will be done automatically" option disabled (see Creating a Base Linearization with an Integrated Measuring Device).
10.Print the test chart in the "Total Ink Limit" module:


11.In the printed test chart, identify the column where solarization starts (for example, too much ink was applied from column 28 onwards).
12.Enable the option "Visual TIL definition" and select the column number you identified:


No more ink will be applied to the paper from this column onward.
13.Click "Next" and proceed with the "Quality Control" module.
You can print and measure the test chart with the measuring device because the total ink limit for this step was set so that too much ink will not be applied. Base linearization will be generated correctly.