
Prerequisite: You can select the "NPDC" view only if a G7 standard is selected as the process standard.
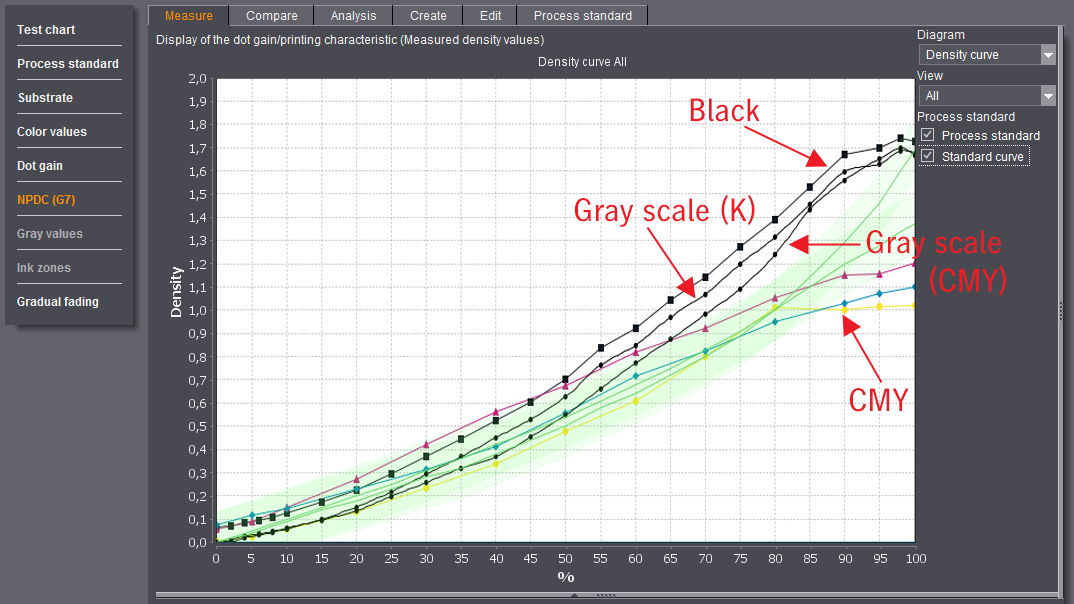
The "NPDC" ("Neutral Print Density Curve") displays separately for CMY (combined) and K (black). The G7 Specification defines standard grayscale curves that are used to create a neutral view of the output on different output devices.
In the curve diagram, you can display either the values for "L*" or for density. In the table in the lower part of the diagram, all of the density values display for C, M, Y, K and both grayscales. This is where you can also see whether single values are out of the tolerance range (cells highlighted in red in the Δ column).

In "View", you can display the density curves separately for the CMY and K grayscales and also for CMYK. The "NPDC (G7)" view shows both grayscale curves at the same time.
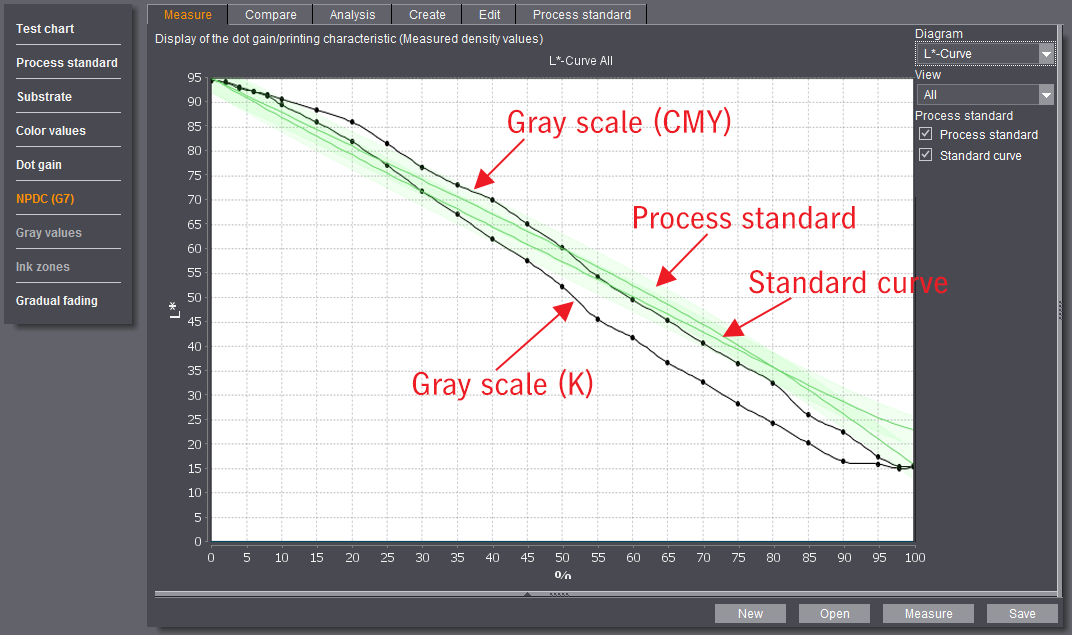
When you select the "L* Curve" diagram, you can view the grayscales for K and CMY compared to the standard curves (green). If you also show the "Process standard", the tolerance range for the standard curves displays and you can detect fast whether the values you determined are within the process standard.
Background
While the evaluations compliant with Fogra in European countries mainly assess the dot gain curves, the primaries, secondaries and tertiaries as well as paper white, but not necessarily gray balance, the G7 method gives priority to gray balance. CMY triplets are defined for this, that in all cases must produce a neutral gray ("Grayscale Compliance"). Only in the second step are the primaries and secondaries of importance ("Targeted Compliance").
The G7 is widespread in North America, Latin America and Asia and is designed to meet the requirements of ISO 12647-2 in commercial offset printing. The calibration and processing monitoring methods of the G7 replace separate values for dot gain by a single gray balance target value. The CTP curves are matched to a predefined gray balance curve for the CMY scale and a separate curve for the Black scale.
The G7 Specification defines the hue with a Neutral Print Density Curve (NPDC) that specifies the relation between the measured neutral density and the original screen percents of a printed grayscale.
Tolerances
To check the tolerances, the accuracy of the NPDC is measured in L* on the CMY Only and Black Only grayscales of the G7-P2P reference value. The accuracy of gray balance is measured on the CMY Only grayscale. The tolerances vary according to the print process. Extremely narrow tolerances are applicable for proofing where the weighted average values for ΔL* have to be at 1.5 or below this and where the scale values for CMY and K must not exceed a ΔL* of 3. The same values are applicable for ΔCh* in the weighted average and for the CMY scale values.
|
Target |
Proof Tolerance |
Print Tolerance |
|---|---|---|
|
Substrate |
≤ 1.5 |
< 3.0 |
|
CMY solid tints |
≤ 3.5 |
< 3.5 |
|
K solid tints |
≤ 5.0 |
< 5.0 |
|
RGB solid tints |
≤ 4.2 |
< 4.2 |
|
IT8.7/4 on the whole |
Average ΔE00 ≤ 2.0 |
Average ΔE00 < 3.5 |
|
|
95th Percentile ΔE00 < 5.0 |
95. 95th Percentile ΔE00 < 5.0 |
Test charts
The G7-P2P51 (previously P2P25, now with the ISO2013 values) is used as the test chart. In addition to the three series in each case for the tonal values in RGB and CMY, it has nine series for the gray values based on CMY.

Note: We recommend M1 as the measurement condition for test measuring the P2P51.
Using "Tools > Gray balance calibration", you can create a suitable calibration for gray balance based on these measured data, preferably with 13 reference points.