The gray balance displays in a table and three diagrams on the ab plane.

Note: This check shows values only if you use a minispot to check the gray balance (see also 'ECI_GrayConL', 'ECI_GrayConM' and 'ECI_GrayConS' with 52, 32 or 6 Patches).
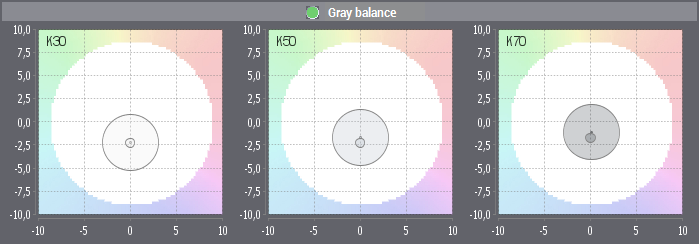
The additional grays of the control strip (K30, K50, K70 and their corresponding chromatic grays in CMY) are evaluated for gray balance. The results display in a table and a graph.
In this case, the L*, a* and b* values for three real grays (black only) are compared at 30%, 50% and 70% with those of the identical chromatic grays (cyan, magenta and yellow) and shown as a table and a diagram with the calculated differential values for lightness distance (ΔL*) and chroma difference (ΔCh* (Ch* = chroma)):
•green if the deviations are within the tolerance range
•red if they are outside it.

Note: In the USA, control strips that evaluate grays "K25" and "K75" instead of "K30" and "K70" are also used. The system detects these grays automatically and switches to the appropriate values.
The ISO 12647-2 process standard specifies that a gray composed of the three chromatic process colors has the same L*, a* and b* values (CIELab) as an identical gray that is printed only with black.
You can find more details in the 'Gray values' View.