
'Smoothing of color data' Dialog
You can open this dialog by clicking "Modify" (smoothing of measured values) in the "Generate profile" dialog > "Show profile options".
Note: You can call up this dialog with the "Test chart > Correct - Smoothing" menu in the "Measure" main function.
Check and smooth color data
In this dialog, you can enable/disable an option for smoothing the measured data as you need it. The correction or smoothing of the measured data comprises two subfunctions:
•plausibility check of the data and
•intelligent, global smoothing.
These two functions can be used separately or as a combination and be applied to the color data of both CMYK and RGB printing processes.
You can basically distinguish between two types of distortion of the color data: on the one hand, those that have a local effect (i.e. at a certain area in the color space) and those whose effect is global and across the entire color space.

Note: You can also use these functions in the "Measure" main function (see 'Smoothing of color data' Dialog).
The difference is that, in "Measure", the color data are changed irrevocably by the correction whereas, in this case, the correction is only applied to profile calculation and the original color data are retained.
When calculating profiles from smoothened color data, remember that an appropriate setting for the profile causes the smoothened data to be smoothened once again.
Enable the correction/smoothing function you want.
Click "OK" to confirm your changes and close the dialog. The measured data are converted.
When you click "Default", the default settings are restored and the dialog closes.
Click "Cancel" to close the dialog and discard any changes to it. The last setting is restored.
Automatic plausibility check of color data
This function lets you adjust implausible values which were detected during the analysis. Such values can result from errors during the measuring process but also from dirt or scratches on the test chart. Such local distortions of the color data are corrected automatically.
In RGB ink jet printers, color transformations which cannot be deactivated take place in the driver software. These are very noticeable in certain tonal value ranges and can result in a loss of quality, something which would be eliminated by measurement correction.
Even with high-precision printing processes, such as proofers, there can be slight, but intentional distortions in vignettes which would be eliminated by a correction of the measured data. This can cause a loss of quality. For that reason, the automatic measurement correction should be deactivated in such cases.
By default, automatic correction of the measured data is enabled for all CMY(K) printing processes and disabled for proofer (for example, ink jet printers) and RGB printing processes.
Intelligent smoothing of color data
You can use this function to eliminate distortions that have a global effect. In this process, empirical models for typical printing processes are used with all the measuring points to eliminate large-scale distortions. This result of the calculation is that the current measured data are smoothened without changing the accuracy greatly.
This method also works with unusual process colors and with printing materials with color cast.
Example of correction or smoothing of measured data
An example is used to explain the effect of smoothing on the measured data.
There are two ways to correct or smooth measured data:
•in the "Measure" main function after the colors are measured (open with "Test Chart > Correct - Smoothing"). When you save the file, this correction overwrites the original measured data, in other words, your data file is modified. To keep the original data, we recommend that you use a different file name when you save the changed data.
•in the "Create" main function (open with "Modify" in "Profile calculation options > Smoothing of measured values" in the "Profile Generation Setup" dialog. This correction affects the measured data that are to be used for profile calculation. The original color data are retained.
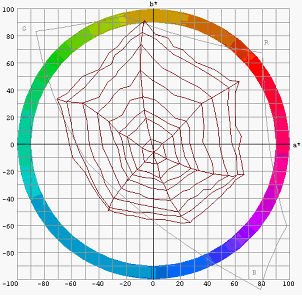
Diagram 1: Critical color data
Diagram 1 shows critical measured data in an ECI test chart of a badly set printing process. Not only are there problems with the actual printing process such as bad ink zone control but also the platesetter was probably badly linearized.
You can basically distinguish between two types of distortion of the color data: on the one hand, those that have a local effect (i.e. at a certain area in the color space) and those whose effect is global and across the entire color space.
The plausibility check corrects the first type of error. Such errors are characterized by the fact that the patches measured in the test chart don't match the other adjacent patches in the color space. The reason for this can be measuring errors, scratches or local effect of a bad ink zone control.
The "wavy lines" in diagram 1 indicate that the last-named reason was quite predominant. The plausibility check adjusts the measuring points of such patches in such a way that they match their surroundings in the color space better.
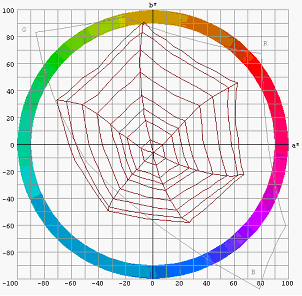
Diagram 2: Effect of the plausibility check
The effect of the plausibility check on the data is shown in diagram 2. You can see that any local occurrences of wavy lines are gone but that the strange tonal gradation is still there (seen by the clearly different spacing of measuring points in the web). There is the occasional process that is actually characterized by such a pattern and where any corrections to this pattern would result in an unwanted distortion (particularly with proofers).
Global smoothing acts against this second type of distortion. In this process, empirical models for typical printing processes are used with all the measuring points to eliminate large-scale distortions, without however defining fixed reference values for solid tints or similar in this process.
For that reason, this method also works with unusual process colors and with substrates with color cast.
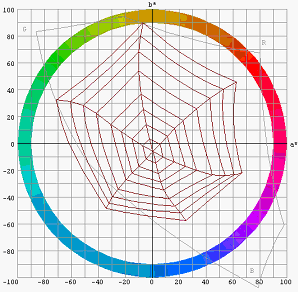
Diagram 3: Result of this correction
The result is shown in diagram 3. You can see that, in this case as well, the tonal gradation has been made harmonic. You can vary the intensity of this correction with the slider between "0" and "10".
Global smoothing is only suitable for measured data that are part of a relatively unadulterated physical printing process. You should not use it or, if so, just a weakened version of it if you cannot influence conversion of the color data, for example, by a printer driver or additional color management that cannot be disabled when you are printing the test chart.