
In this dialog you can select a reference profile and a color table so that you can visually compare the locations of the spot colors from the table with the color gamut of an ICC profile.
If you select "Manual" instead of a color table, you can enter the Lab values of a spot color and check the location of a single color in relation to the color gamut.
Note: At present, this function is available only in the "Measure" main function.
After you click "OK", you will see a 3D view with statistical results in the caption bar.
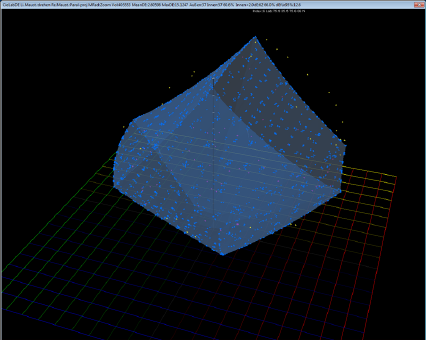
You can rotate the view holding down the left mouse button or view a parallel projection holding down the right mouse button. You can scale up and scale down the view with the mouse wheel. When you move the mouse pointer to one of the dots, the index of this dot displays below the caption bar, with the Lab values if applicable.
For details, see also "Video Tutorials":
•Check spot color locations in target color space in 3D diagram