You can open the "Gray balance optimization" dialog using the "Tools" menu in all the main functions.
In this dialog you can calculate the required gray balance optimization data for process calibration in order to optimize the gray balance.
Gray balance optimization is used in cases where it is clear that manual correction of gray must be done at the press on a regular basis.
Gray balance optimization optimizes existing process calibrations to enhance their gray balance. Suitable minispots are also printed on the production jobs for this (ECI-GrayCON_L. M or S). The use of a G7-compatible print control strip is now possible if you are printing compliant with the G7 specification. These measured data are evaluated in Prinect Color Toolbox. After that, the correction data for process calibration are calculated. These data are then imported to the Calibration Tool and set off against the existing process calibration. Afterwards a new plate set is imaged and a new proof print is made to check dot gain and gray balance.
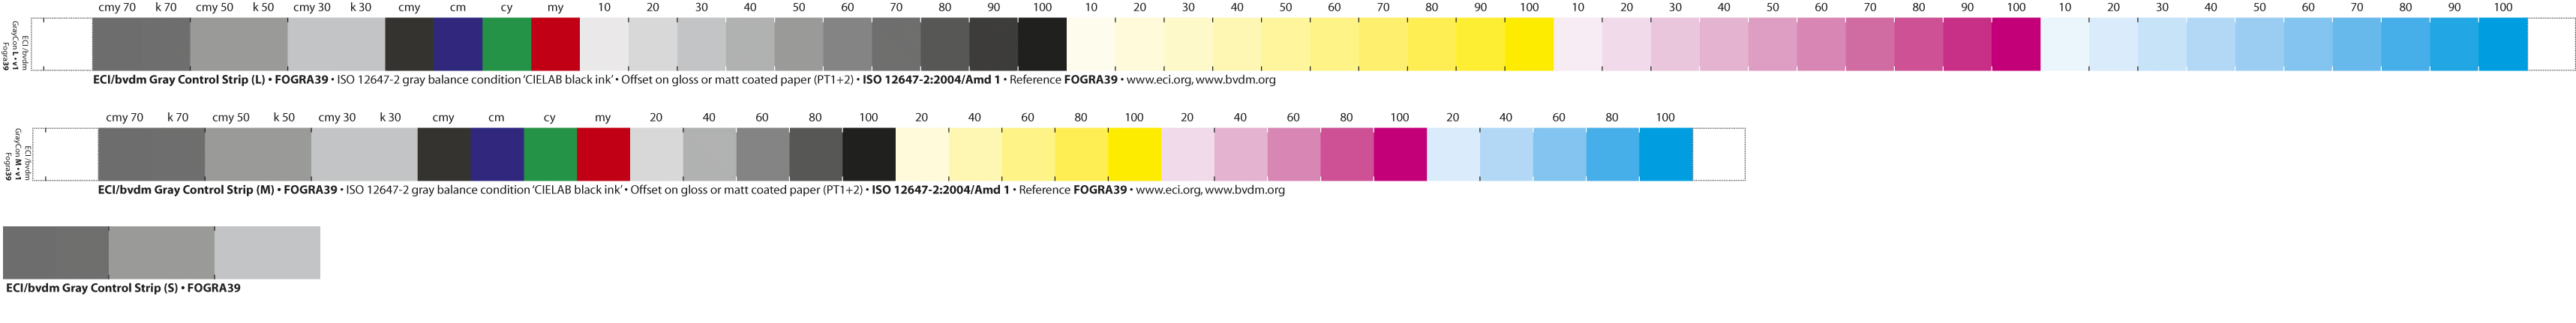
ECI together with BVDM developed gray control strips for the usual print conditions for a visual check and a technical one with an instrument. For this purpose, the color data for specific black patches (30%, 50%, 70%) were determined on the printing material and chromatic color combinations with the same degree of brightness were calculated from the ICC profile. These two patches (black, chromatic gray) were placed side by side, making a visual comparison possible. A technical comparison using an instrument is also possible and implemented in the Quality Monitor.
Gray balance optimization in the Prinect workflow
Print minispots
•use a calibrated process as a basis
•use ECI_GrayCon_L/M/S (see 'ECI_GrayConL', 'ECI_GrayConM' and 'ECI_GrayConS' with 52, 32 or 6 Patches) if you are printing using ISO 12647-2 or Process Standard Offset (PSO) or use a G7 print control strip if you are printing compliant with the G7 specification.
Gray balance optimization
The color data of the minispots and a reference print condition are used in the Profile Tool to calculate the correction data.
Correction data
The correction data are saved in Prinect Color Toolbox and imported to the Calibration Tool.
Calibration Tool
In Calibration Tool, the existing process calibration is optimized using the correction data from Prinect Color Toolbox.
Prinect Workflow
The new calibration is enabled for plate output.
1.The color data of the minispots are checked in the Quality Monitor in the "Analysis" main function. The data of five to eight press sheets are used for this. Ideally there are two ECI-GrayCON_xx control elements on each press sheet. The data outliers are disabled; the remaining data sets are averaged to generate the correction data.
2.Go to gray balance optimization with the "Tools" menu. First, open the reference profile of the target process and after that the data that were averaged beforehand. Then calculate the correction values that will display in the table on the right. To conclude, save your correction data.
3.In the Calibration Tool open the process calibration matching the process. Select "Curve Modification" and "Correction of Gray Balance". A window for the import of the correction data opens. After the correction data are included, image a new plate set and make a proof print to check the enhanced gray balance.
New minispots for the evaluation of gray balance
Four variants of a new minispot are also available for the evaluation of the gray balance:
•PCM_GrayConL_i1_39: Paper grade 1 and 2, gloss coated and matt coated
•PCM_GrayConL_i1_43: FM screen, paper grade 1 and 2, gloss coated and matt coated
•PCM_GrayConL_i1_44: FM screen, paper grade 4, uncoated white
•PCM_GrayConL_i1_47: Paper grade 4, uncoated white
The advantages of these minispots are that there are 10 color patches for each color channel, in addition six color patches for the evaluation and calculation of the gray balance: K30, K50, K70 as well as CMY30, CMY50 and CMY70. You can measure these strips with the X-Rite EyeOne strip in two measure runs.