"Zone analysis" Operation Report"
Operation reports "Zone Analysis" show quality evaluations of each ink zone of the selected operation. This lets you easily identify critical ink zones. The zone analysis covers the measured values Delta E, density and dot gain. There is a separate quality report for each of the measured values. Select the desired report with the query criteria in the navigation pane to the left.
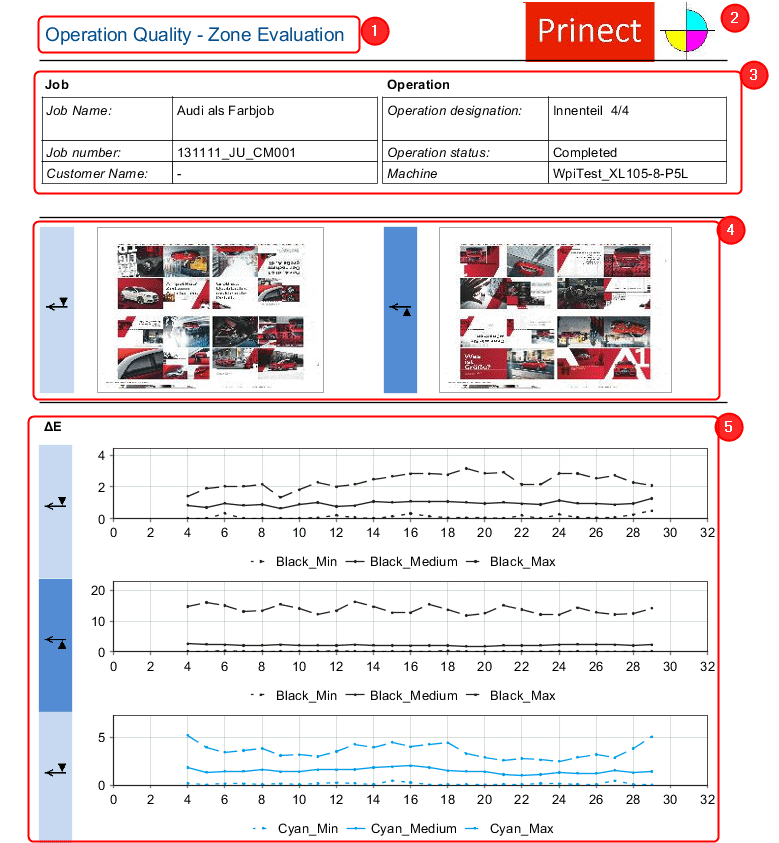
Report "Zone Analysis"
Report title (1)
The logo you selected (2). See Logo.
Header data (3):
•Information regarding the job
•Information regarding the operation
Thumbnails for front and back (4)
Zone analysis charts (5):
Depending on the selected measuring value, the zone analysis of Delta E, density or dot gain is shown for each color. A chart each is displayed for front and back. The evaluations comprise all measurements available for the operation (OK sheet and waste sheet measurements).
The zone analysis charts, depending on the selected report (Delta E, density or dot gain), are explained below.
•"Zone analysis ΔE" charts:

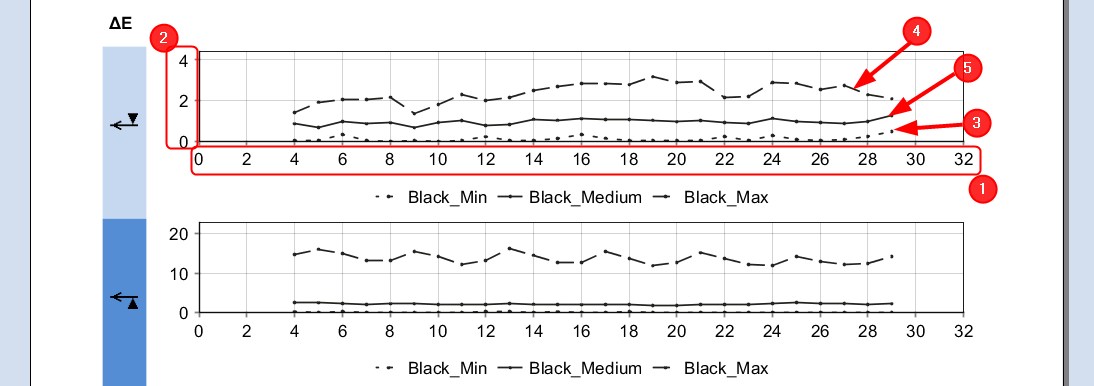
·X axis (1):
Ink zones of the press
·Y-axis (2):
Delta E
·Min Delta E (3):
Graph of the smallest measured values for Delta E for each ink zone
·Max Delta E (4):
Graph of the greatest measured values for Delta E for each ink zone
·Medium Delta E (5):
Graph of the average measured values for Delta E for each ink zone

Note: The values for Min and Max can be taken from different measurements. In other words, the smallest and the greatest value of all measurements are shown for each ink zone.
•"Zone analysis density" charts:

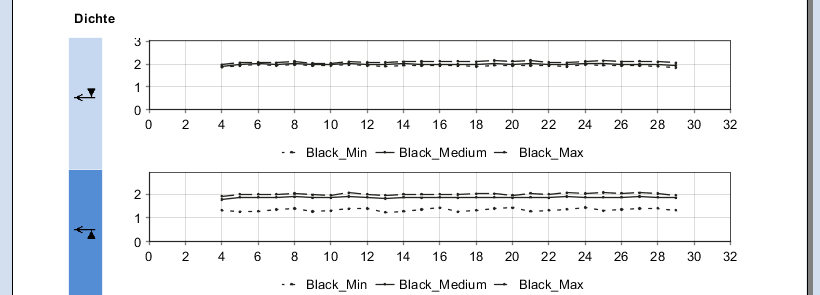
The structure of the "Zone analysis density" and "Zone analysis ΔE" charts is identical. In this case, the Delta E value is replaced with the density value.
•"Zone analysis dot gain" charts:
Zone analysis for each area coverage that has measured data (e.g. 20%, 40% and 80%).

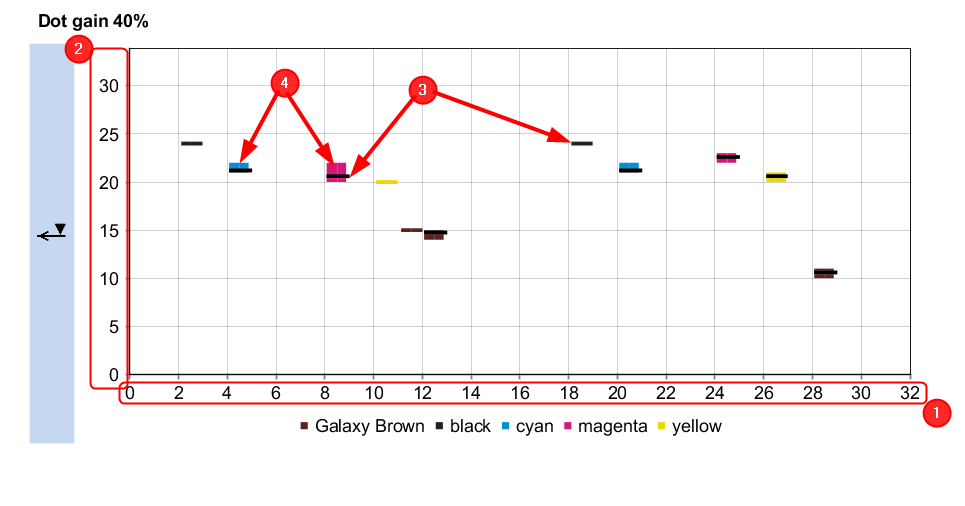
·X axis (1):
Ink zones of the press
·Y-axis (2):
Dot gain in percent
·Average dot gain value (3):
A black line indicates the average measured dot gain of each ink zone.
·Dot gain deviations (4):
Dot gain deviations from the average value within one ink zone are represented by a column above and below the average value. In the example (figure above), Magenta in ink zone 9 deviates upwards by approx. 1.5 percent.

Note: There are only measured values for ink zones for which the control strip has dot gain measurement fields. This depends on the selected dot gain (e.g. 40%).
Measuring conditions:
The measuring conditions are indicated for each zone analysis.