
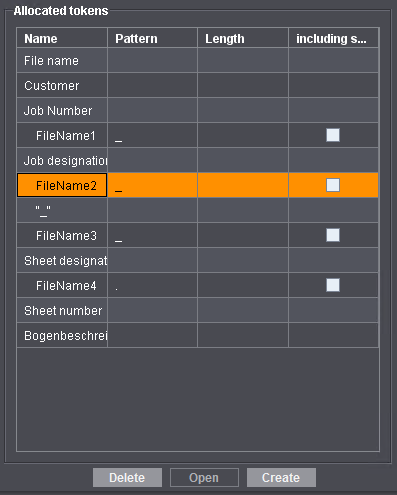
If an attribute is generated from two tokens and these are not to be written simply one after the other, you can insert a separator. For example the separation character _ for separating the tokens "FileName2" and "FileName3".
1.Highlight the token in the "Allocated tokens" section after which the separation character is to be inserted.
In this example "FileName2".
2.Now click the "Generate" button in the "Allocated tokens" section.

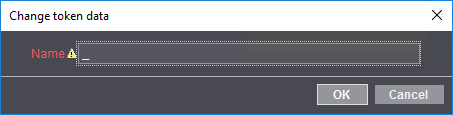
3.Click in the "Name" box and enter "_" as the separator.
4.Click "OK".
The separator is applied and is now located below the highlighted token in "Allocated tokens".
In this example under "FileName2".
Now you can allocate another token after the separation character.
1.On the left in the open "Attribution rules" folder, click the attribution rule you wish to edit.
Its settings display on the right and you can edit them there.
2.Edit the attribution rule.
This procedure is described in detail in the section Create new attribution rule.
3.Click "Save".
The changes are saved.
1.Highlight the attribution rule to be deleted.
2.Click "Delete".
3.Confirm the alert message with "OK".
Transfer curves (characteristic printing curve)
The transfer curve (characteristic printing curve) visualizes the relationship between the tonal values of prepress products, such as the screening data of the printing plate, and the related tonal values in printing. Dot gain is derived from this.
With the transfer curve (characteristic printing curve) you can correct tonal value changes that occur during the printing process. Dot gain refers to the increase in the size of screen dots caused by printing. This can make an image appear darker (fuller) and/or cause color shifting to occur. Example: A screen area created with 80 % results in a coverage of 90 % during printing. The dot gain would be 10% in this case.
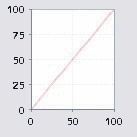
Dot gain is the deviation from the ideal characteristic printing curve. It runs in a straight line and rises at an angle of 45°. The characteristic printing curve is dependent on factors such as the ink, paper properties, printing plate and the way the printing press works.
•Y-axis: Indicates the "print" area coverage in percent.
•X-axis: Indicates the "printing plate" area coverage in percent.

Note: The characteristic printing curve (transfer curve) is set individually for each process. If the same job is printed on a different printing press (different processes), the final result will also be different.