
Prerequisite: This displays only if "Sheet Preview Generation" is enabled in the "ImpositionOutput" sequence.
Before printing, it is often advisable to check the print image you are expecting. By doing this, you can avoid problems in printing and save waste sheets and costs.
The "Ink Profile" tab provides you with one way of checking the print image: Show a print image preview as a composite print or as a single color separation
In the "Ink Profile" tab, you can view the whole press sheet as a preview. In the "Separation" list on the left of the window select "All Colors" to view the image as a composite print.
You can view a separate preview of each color separation by selecting the single colors. A diagram of the area coverage values displays, varying according to the color selected (see Showing Area Coverage Values for Each Sheet).
The display of the average coverage values serves as a back-up check. You can check at a glance whether the ink profile and the printing plates are correct and whether you are dealing with the job to be processed.
You have the following options to display the area coverage values:
•Display in the "Ink Profile" tab as described below.
•Display in the "Ink Consumption" tab (see Showing Area Coverage Values for Each Sheet)
This display is more detailed and shows you the exact area coverage values per ink and ink zone.
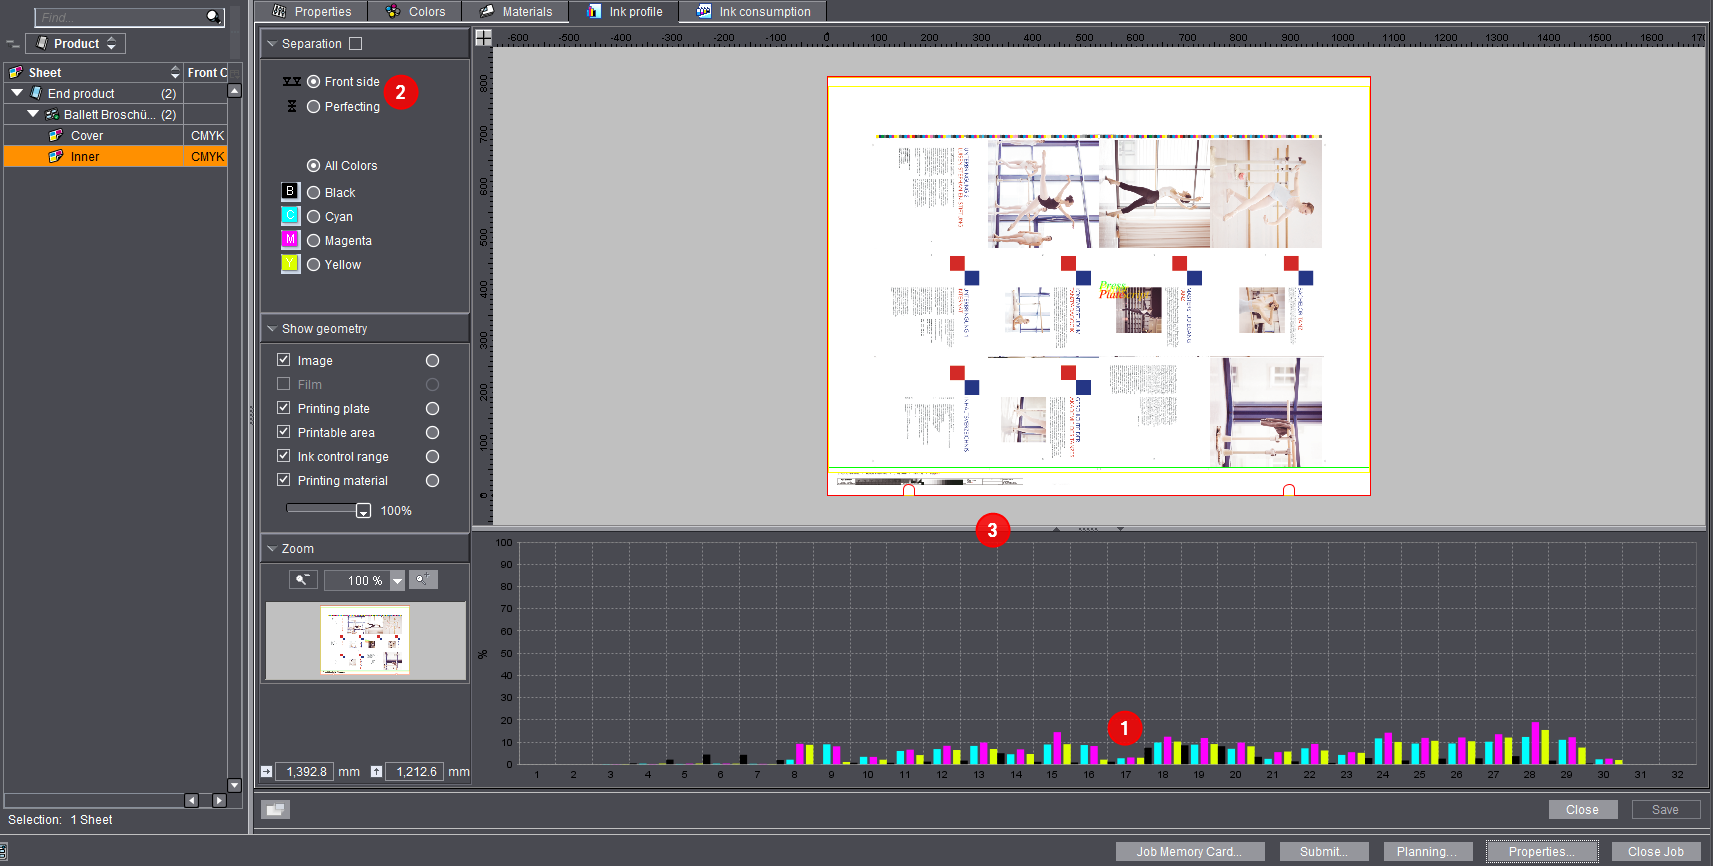
The ink zone histogram below the sheet (1) shows the area coverage values of the single ink zones. If the print job consists of printing the front and the back, you can switch between both sides in the "Separation" list on the left of the window (2).
You can change the window size by positioning the mouse pointer on the splitter bar between the sheet and the ink zone histogram and dragging it up or down (3).
In addition you can show or hide the sheet or the ink zone histogram by clicking on the arrows on the dividing line. The ink zone histogram shows you a graph of the area coverage values of the single ink zones. Depending on what you selected in "Separation", the area coverage values display all the colors or single color separations.
The ink zones are displayed on the horizontal axis (x axis).
The vertical axis (y axis) shows the area coverage values in percent.
Viewing the total inking of a press sheet
Definition of terms used
The term "total inking" is used in four-color printing or specifically in offset printing and indicates the maximum amount of ink required to generate (reproduce) the colors. In four-color printing, total inking of 240%, for example, means that the sum of the base color components (cyan, magenta, yellow, black) does not exceed this value. As a general rule, the higher the total inking, the darker the color to be reproduced. For example, a black can be made up of 80% cyan, 40% magenta, 20% yellow and 100% black (which equals 240%). The permitted total inking depends on the production conditions when printing and the substrate used (for example the paper). The total inking also has a direct influence on the drying time.
To check total inking
1.To view total inking, enable the "Separation" option.

There are now two ways to display total inking:
•Display total inking using a threshold ("Index Color" disabled)
Use the slider to set total inking for the press sheet. For example, set the value to 300%. Then all the points on the sheet whose total inking is greater than 300% display. The display varies according to the colors selected. You should enable all the colors when displaying total inking.
•Display total inking using "Index Color"
An adjustable step limit is not used with this variant; instead, the sections of the sheet are displayed in a color scale from green to red depending on the respective total inking in those areas. Green represents low total inking while red illustrates high total inking.
These options let you define the geometry data to be displayed. You can thus check the print image for correct position and geometry. You can, for example, check whether the print image is within the printable area by enabling the "Printable Area" option (3).
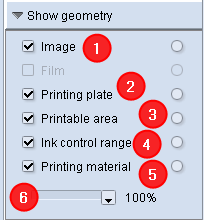
"Image" option
You can show or hide the print image using the "Image" option (1). This is useful if you only want to view the geometric values. The print image no longer displays if you disable the option (1).
"Printing plate" option
If the "Printing plate" option is enabled (2), placement of the print image on the printing plate is shown (red frame in the graphic). You either see a printed image preview as an overprint of all color separations or as a single color separation. If you selected just one separation, the display will be in black-and-white.
Use this option to verify that the print image is positioned correctly on the printing plate.
"Printable area" option
The "Printable area" option (3) shows whether the print image might lie on the gripper margin (green frame in the graphic).
"Ink control range" option
If the "Ink control range" option (4) is enabled, the ink zones will be shown or hidden in the print image. For the ink zones to be "visible" in the print image, you need to set the slider (6) to at least < 80%.
"Printing material" option
The "Printing material" option (5) shows whether the print image "lies" completely on the paper (yellow frame in the graphic).
Slider
The slider (6) is used to show or hide the ink zones in the print image when the "Ink control range" option is enabled. If you set the slider to 0%, the print image will be completely hidden and only the ink zones of the print image will be shown.
Zoom function (magnifier)
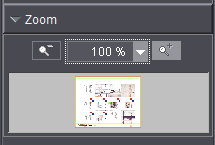
With the zoom function you can zoom in on details of the print image (in the main window). The scaling is set to 100% by default. At 100% the zoom-out symbol is grayed out. The zoom-in symbol is active. A smaller image of the gray main window (large print image) is displayed in a thin black frame in the zoom window itself. The coordinates of the current mouse pointer position are displayed beneath the zoom window.
Example:
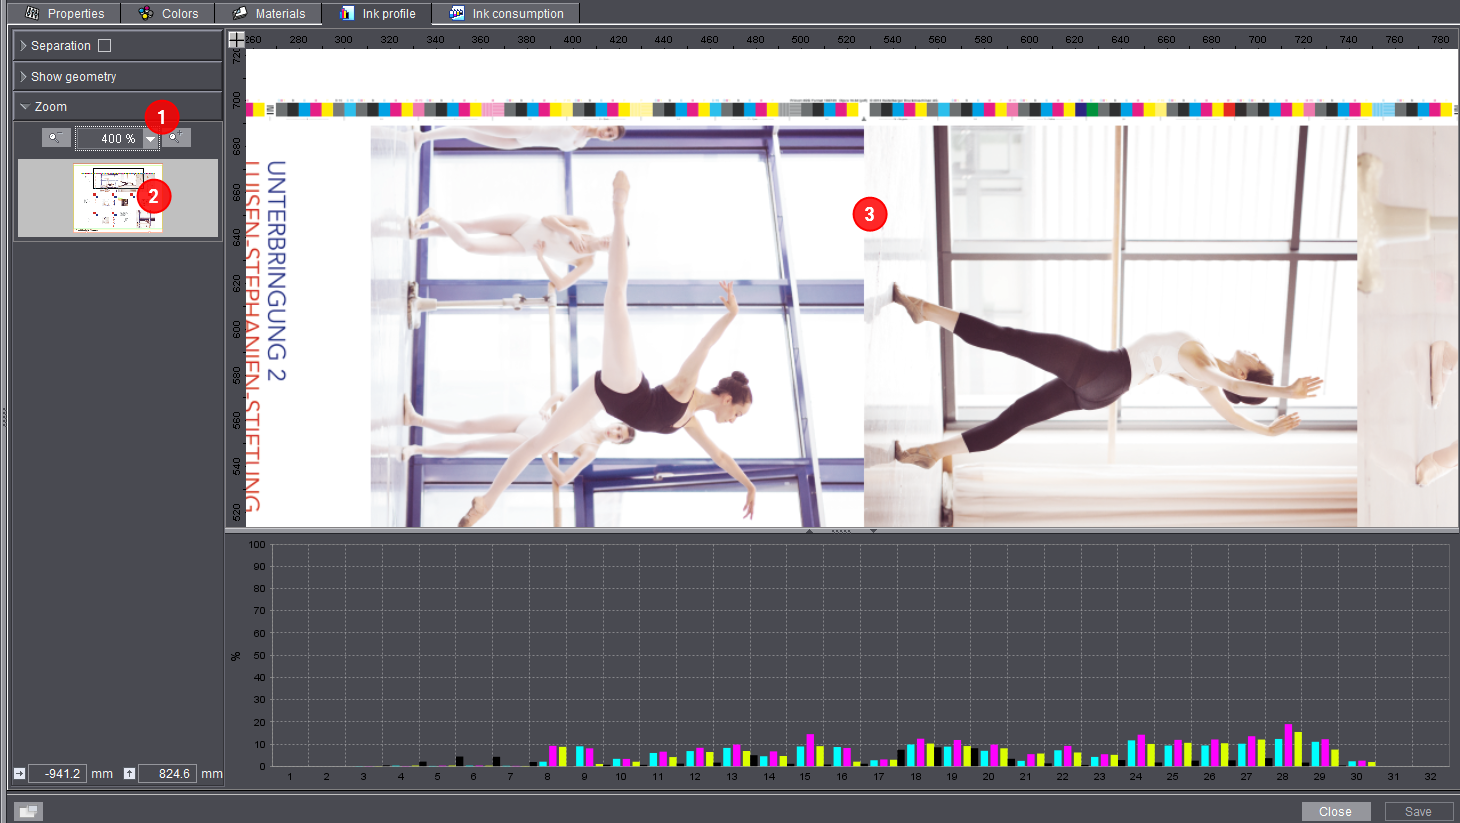
1.Set the zoom value to 400% (1).
The black frame is now smaller than the zoom window and is located in the top left corner of the zoom window.
2.Now drag the black frame in the zoom window with the mouse to the position you want (2).
In the large main window this part of the print image is now zoomed in (3).