Transfer curves (characteristic printing curve)
The transfer curve (characteristic printing curve) visualizes the relationship between the tonal values of prepress products, such as the screening data of the printing plate, and the related tonal values in printing. Dot gain is derived from this.
With the transfer curve (characteristic printing curve) you can correct tonal value changes that occur during the printing process. Dot gain refers to the increase in the size of screen dots caused by printing. This can make an image appear darker (fuller) and/or cause color shifting to occur. Example: A screen area created with 80 % results in a coverage of 90 % during printing. The dot gain would be 10% in this case.
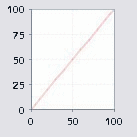
Dot gain is the deviation from the ideal characteristic printing curve. It runs in a straight line and rises at an angle of 45°. The characteristic printing curve is dependent on factors such as the ink, paper properties, printing plate and the way the printing press works.
•Y-axis: Indicates the "print" area coverage in percent.
•X-axis: Indicates the "printing plate" area coverage in percent.

Note: The characteristic printing curve (transfer curve) is set individually for each process. If the same job is printed on a different printing press (different processes), the final result will also be different.