•Calculated Margin % for top 5 customers
•Real Margin % for top 5 customers
•Real and Calculated Margin in % by Customer Group
•Real and calculated margin in % by month
•Real and calculated margin in % per product group
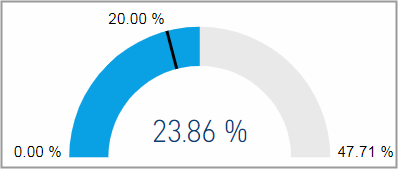
Calculated margin in percent for the selected time period.
Facts & Dimensions:
·Value: Calculated Margin %
·Tooltip: Invoiced Value
·Tooltip: Calculated Cost
·Tooltip: Calculated Margin

Real margin in percent for the selected time period.
Facts & Dimensions:
·Value: Real Margin %
·Tooltip: Real Cost
·Tooltip: Real Margin
Calculated Margin % for top 5 customers
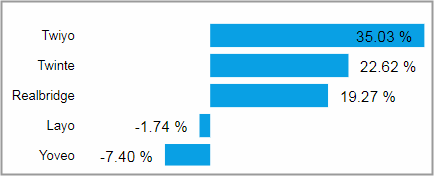
This visual shows the calculated margin % for your top customers. The customers are sorted by invoiced value.
Facts & Dimensions:
·Y-axis: Customer
·X-axis [%]: Calculated Margin %
·Tooltip: Invoiced Value
·Tooltip: Calculated Cost
·Tooltip: Calculated Margin
Drillthrough:
Real Margin % for top 5 customers
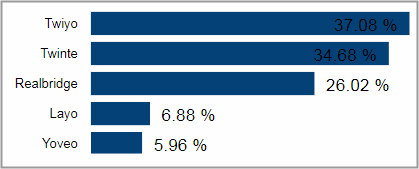
This visual shows the real margin % for your top customers. The customers are sorted by invoiced value.
Facts & Dimensions:
·Y-axis: Customer
·X-axis [%]: Real Margin %
·Tooltip: Real Cost
·Tooltip: Real Margin
Drillthrough:
Real and Calculated Margin in % by Customer Group
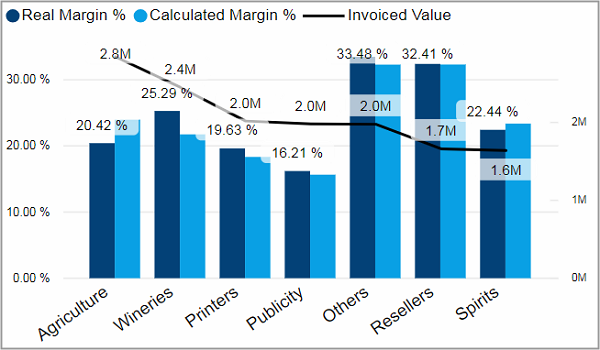
This visualization compares the real and the calculated margin in percent for your top 7 customer groups. The customer groups are sorted by their invoiced value. The invoiced value per customer group is represented by the black line.
Facts & Dimensions:
·Y-axis Dark blue [%]: Real Margin %
·Y-axis Light blue [%]: Calculated Margin %
·Y-axis (2nd) Black line [currency]: Invoiced Value
·X-axis: Customer Group
·Tooltip: Invoiced Value
·Tooltip: Calculated Margin
·Tooltip: Real Margin
Drillthrough:
Real and calculated margin in % by month
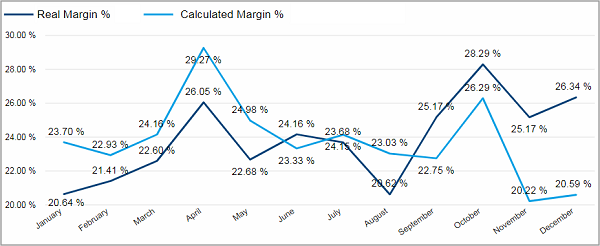
Facts & Dimensions:
·Y-axis Dark blue line [%]: Real Margin %
·Y-axis Light blue line [%]: Calculated Margin %
·X-axis [date]: Month Name
·Tooltip: Invoiced Value
·Tooltip: Calculated Margin
·Tooltip: Real Margin
Real and calculated margin in % per product group
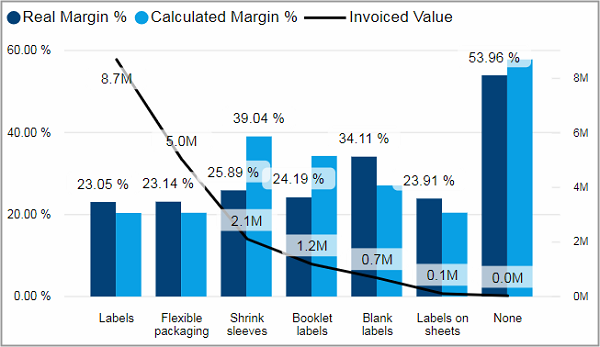
This visualization shows the real and the calculated margin in percent for your top 7 product groups. The product groups are sorted by their invoiced value. The invoiced value is represented by a black line.
Facts & Dimensions:
·Y-axis Dark blue [%]: Real Margin %
·Y-axis Light blue [%]: Calculated Margin %
·Y-axis (2nd) Black line [currency]: Invoiced Value
·X-axis: Product Group
·Tooltip: Invoiced Value
·Tooltip: Calculated Margin
·Tooltip: Real Margin
Drillthrough: