•Invoiced Value and Calculated Margin % by Customer
•Calculated Margin % and Invoiced Value by Customer Group
•Calculated Margin % and Invoiced Value by Current Representative
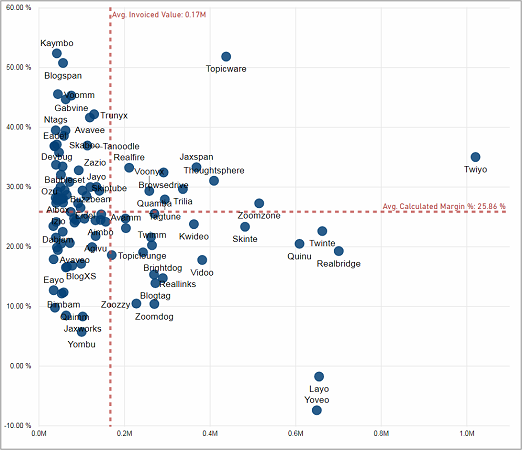
Invoiced Value and Calculated Margin % by Customer
With this visual you can compare the calculated profitability of your customers.
Your customers are placed on a scatter chart depending on their Invoiced Value and Calculated Margin %. Each customer is represented by a dot. The higher and the further to the right the dot is placed the more valuable is the customer. The dashed red lines mark the average values for Invoiced Value and Calculated Margin %. They give you an orientation how your customers are performing compared to the rest.
You can right click on a customer and select "Drill Down" to see all his products.
The chart is filtered to only show the top 100 customers (regarding their invoiced value).
Facts & Dimensions:
·Y-axis [%]: Calculated Margin %
·X-axis [currency]: Invoiced Value
·Dots: Customer
·Drill Down => Dots: Product
·Tooltip: Calculated Cost
·Tooltip: Calculated Margin
Drillthrough:
Calculated Margin % and Invoiced Value by Customer Group
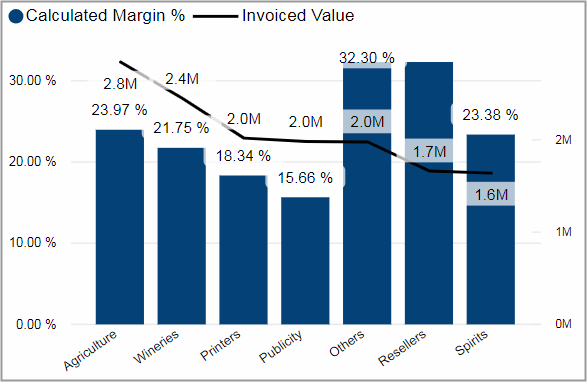
This visual shows the calculated margin % and invoiced value for your top 7 customer groups (regarding invoiced value).
Facts & Dimensions:
·Y-axis Dark blue [%]: Calculated Margin %
·Y-axis (2nd) Black line [currency]: Invoiced Value
·X-axis: Customer Group
·Tooltip: Calculated Cost
·Tooltip: Calculated Margin
Drillthrough:
Calculated Margin % and Invoiced Value by Current Representative
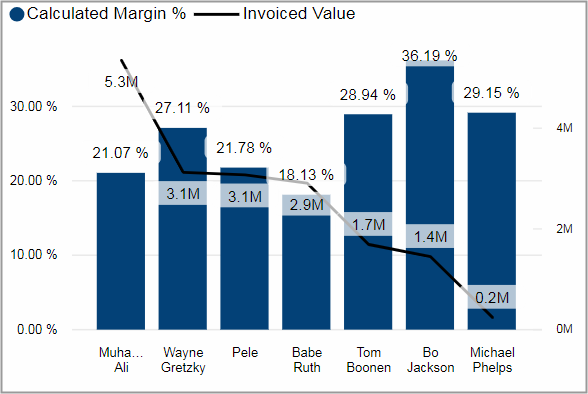
This visual shows the calculated margin % and invoiced value for your top 7 representatives (regarding invoiced value).
Facts & Dimensions:
·Y-axis Dark blue [%]: Calculated Margin %
·Y-axis (2nd) Black line [currency]: Invoiced Value
·X-axis: Current Representative
·Tooltip: Calculated Cost
·Tooltip: Calculated Margin
Drillthrough: