•Waste volume by month and by year
•Net volume per operation by month and by year
•Waste percentage by month and by year
•Waste volume per operation Month by month and by year
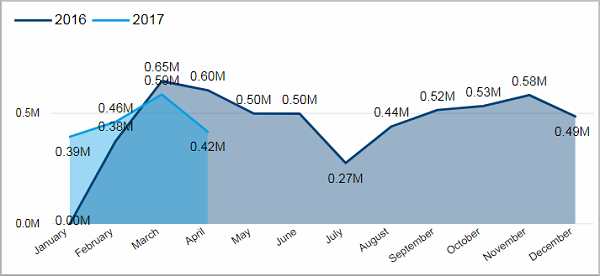
Waste volume by month and by year
This chart shows the waste volume for each month of the year.
Facts & Dimensions:
•Y-axis [units]: Waste Volume
•Colors by: Year
•X-axis [date]: Month Name
Net volume per operation by month and by year
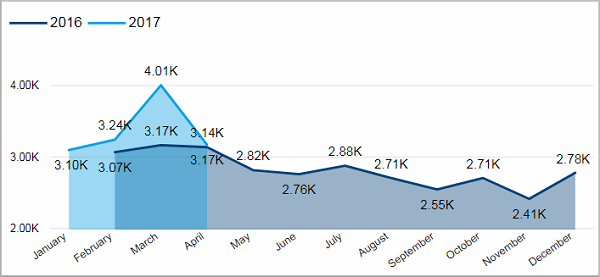
This chart shows the net volume per operation for each month of the year.
Facts & Dimensions:
•Y-axis [units]: Net Volume per Operation
•Colors by: Year
•X-axis [date]: Month Name
Waste percentage by month and by year
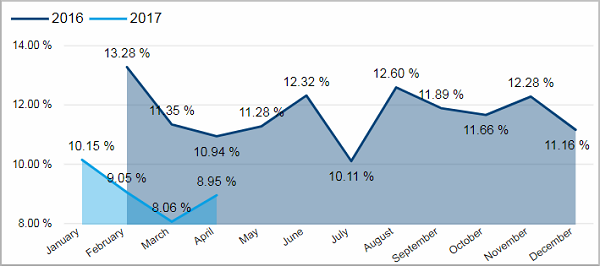
This chart shows the waste percentage for each month of the year.
Facts & Dimensions:
•Y-axis [%]: Waste (%)
•Colors by: Year
•X-axis [date]: Month Name
Waste volume per operation Month by month and by year
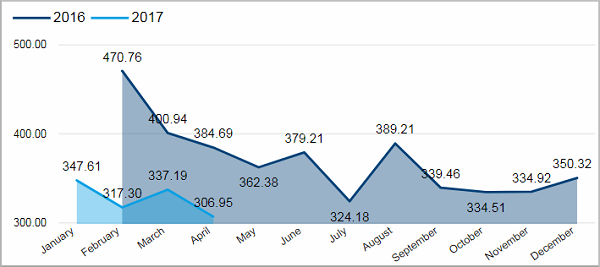
This chart shows the waste volume per operation for each month of the year.
Facts & Dimensions:
•Y-axis [units]: Waste Volume per Operation
•Colors by: Year
•X-axis [date]: Month Name