(Change language of this page to: English, Deutsch)
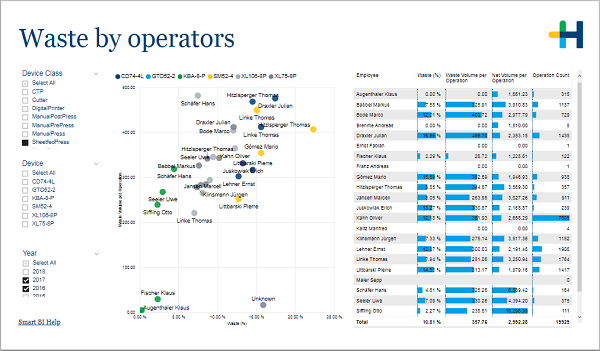
This page shows you the waste results for the operators.
....
The scatter chart places your operators on a grid of waste percentage and average make-ready waste per operation. The color indicates the device.
In the filter area on the left you can adjust which devices and years are included in the charts.