•Operating Time (h) by device and Time type
•Effective Processing Time (h) by date and device
•Operating Time (h) by device and Time type
•Production Time (h) by date and device
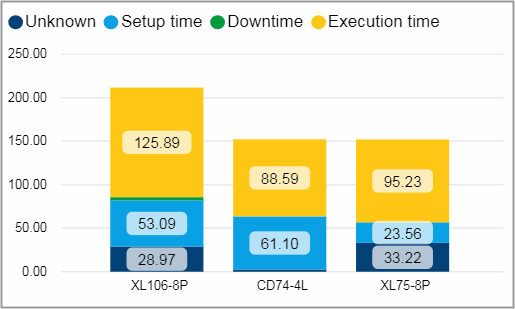
Operating Time (h) by device and Time type
This chart shows you how many hours a device spent in the different time phases. The yellow column shows the actual production time, while during the rest the device was setup or stood still.
Facts & Dimensions:
•Y-axis [h]: Operating Time (h)
•Colors by: Time type
•X-axis: Device
Drillthrough:
Effective Processing Time (h) by date and device
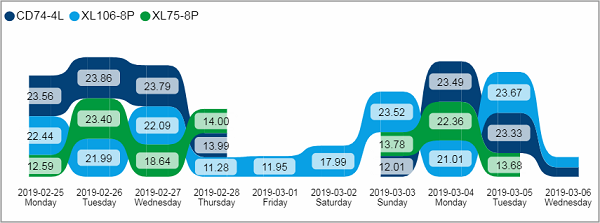
This visual shows the effective processing time for each device on each of the last 10 days.
This is the time a machine is occupied by processing operations. It begins by starting an operation and ends by finishing this operation.
Facts & Dimensions:
•Y-axis [h]: Effective Processing Time (h)
•Colors by: Device
•X-axis [date]: Date and Day Name
Drillthrough:
Operating Time (h) by device and Time type
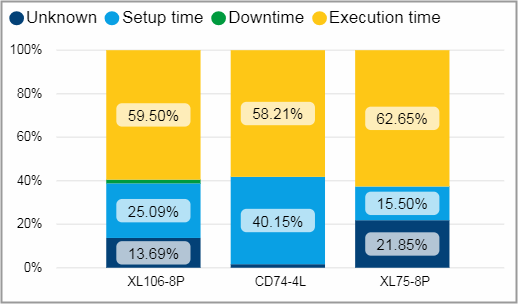
This visual shows the same measures as the one above, but instead of displaying absolute values for the hours spent in each phase, this chart shows which percentage of the whole operating time the phases represent.
In this example the device XL106-8P spent 126 hours in execution time during the last 10 days, as you can see in the first visual. This constitutes to 59,5% of the time the device was switched on.
Facts & Dimensions:
•Y-axis [h]: Operating Time (h)
•Colors by: Time type
•X-axis: Device
Drillthrough:
Production Time (h) by date and device
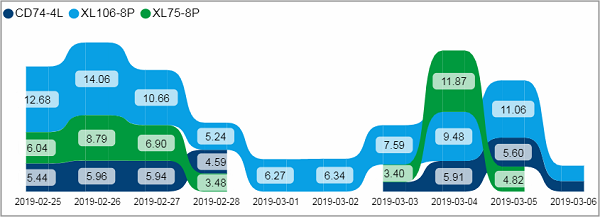
This visual shows the production time for each device on each of the last 10 days. This is the time the device is producing any kind of results excluding any stops.
This chart shows only the time that was used for production while the visual above also factors in the time that the device was setup or stood still.
In this example you can see that the device CD74-4L is steadily running close to 24h a day (visual above). During this time it constantly produces for short to 6 hours a day. It is good that the values are steady during the last 10 days. Nevertheless look for a constant factor to increase the production time.
Facts & Dimensions:
•Y-axis [h]: Production Time (h)
•Colors by: Device
•X-axis [date]: Date
Drillthrough: