(Change language of this page to: English, Deutsch)
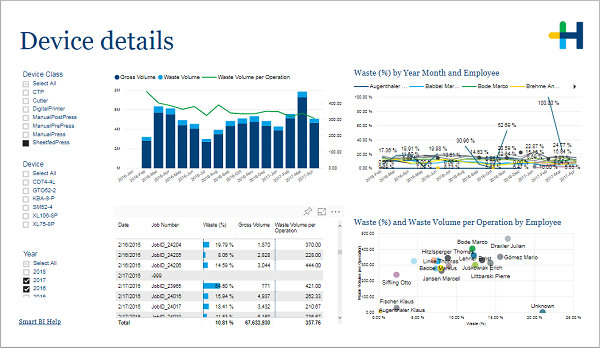
This page is also accessible through drillthrough functionality from s different pages and tiles in the report.
....
In the filter area on the left you can adjust which devices and years are included in the charts.
Gross volume, waste volume and waste volume per operation
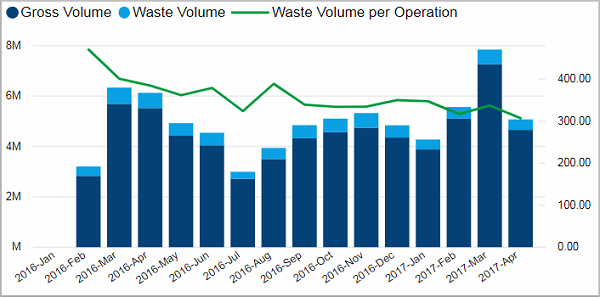
Facts & Dimensions:
•Y-axis Dark blue [units]: Gross Volume
•Y-axis Light blue [units]: Waste Volume
•Y-axis (2nd) Green line [units]: Waste Volume per Operation
•X-axis [date]: Year Month
•Drill Down => X-axis [date]: Date
Waste percentage by month and employee
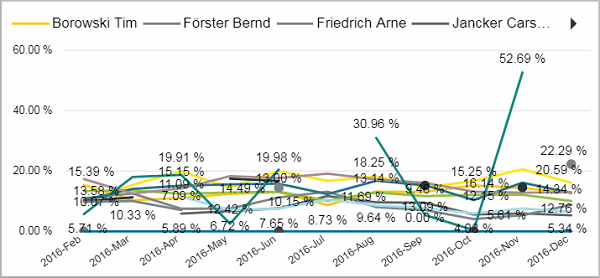
Facts & Dimensions:
•Y-axis [%]: Waste (%)
•Colors by: Employee
•X-axis [date]: Year Month
•Drill Down => X-axis [date]: Date
Table of jobs and waste percentage
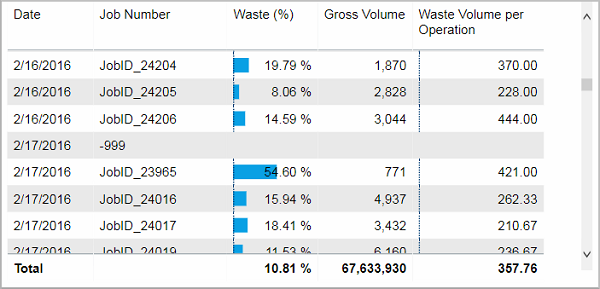
Facts & Dimensions:
•Date
Waste percentage and waste volume per operation by employee
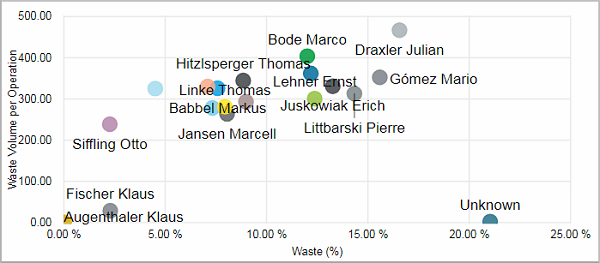
Facts & Dimensions:
•Y-axis [units]: Waste Volume per Operation
•Dots: Employee
•X-axis [%]: Waste (%)