(Change language of this page to: English, Deutsch)
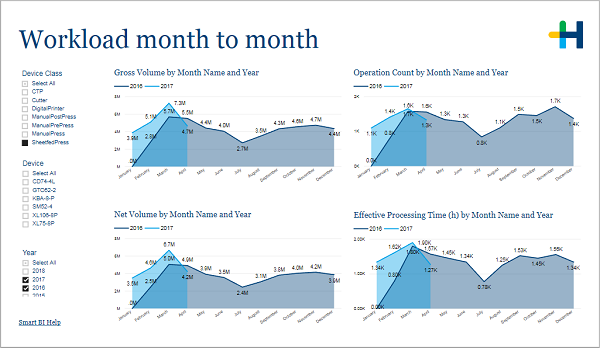
On this page you can compare monthly workload results (gross volume, operation count, net volume and effective processing time) for different years. It helps you to identify seasonal regularities and changes.
....
In the filter area on the left you can adjust which devices and years are included in the charts.
•Gross volume by month and by year
•Number of operations by month and by year
•Net volume by month and by year
•Effective processing time by month and by year
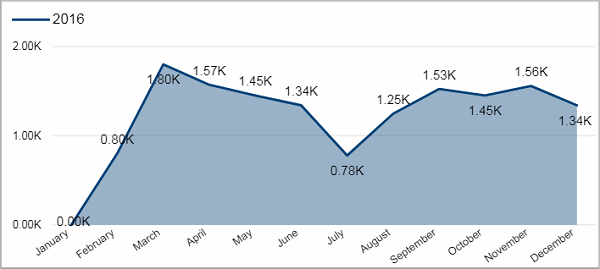
Gross volume by month and by year
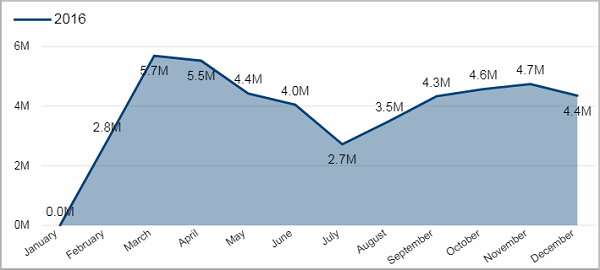
Facts & Dimensions:
•Y-axis [units]: Gross Volume
•Colors by: Year
•X-axis [date]: Month Name
Number of operations by month and by year
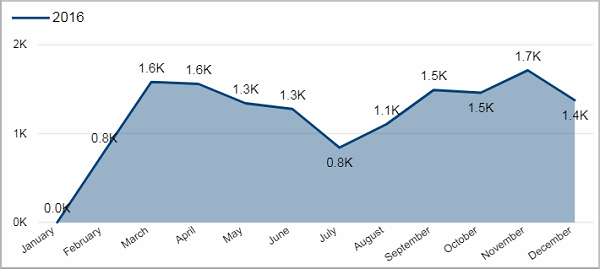
Facts & Dimensions:
•Y-axis: Operation Count
•Colors by: Year
•X-axis [date]: Month Name
Net volume by month and by year
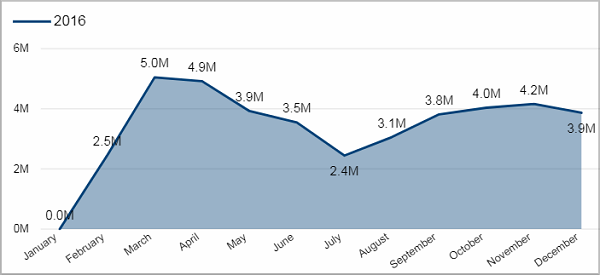
Facts & Dimensions:
•Y-axis [units]: Net Volume
•Colors by: Year
•X-axis [date]: Month Name
Effective processing time by month and by year
Facts & Dimensions:
•Y-axis [h]: Effective Processing Time (h)
•Colors by: Year
•X-axis [date]: Month Name