(Change language of this page to: English, Deutsch)
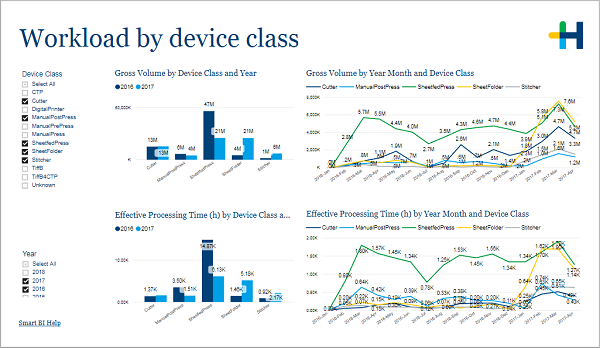
This page shows you the workload results for different device classes.
....
In the filter area on the left you can adjust which devices and years are included in the charts.
Goal: Find the available spare capacity by recognizing the workload and seasonality on Device Class level.
•Gross volume by device class and year
•Gross volume by month and device class
•Effective processing time by device class and year
•Effective processing time by month and device class
Gross volume by device class and year
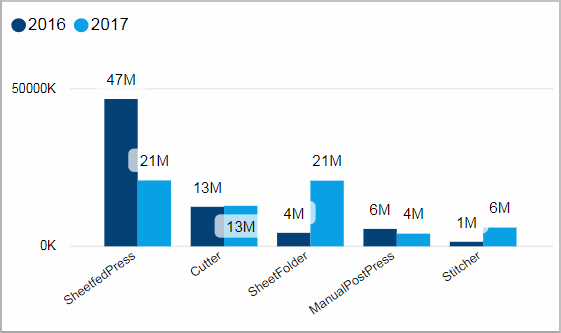
Facts & Dimensions:
•Y-axis [units]: Gross Volume
•Colors by: Year
•X-axis: Device Class
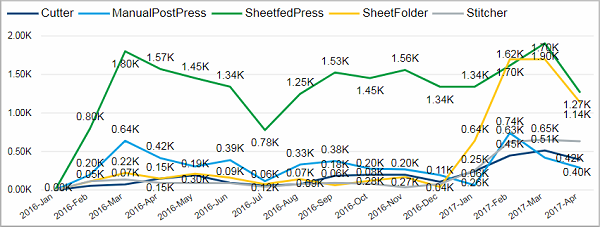
Gross volume by month and device class
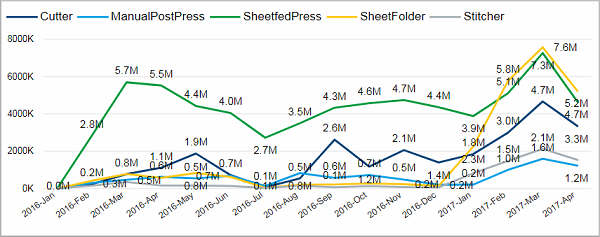
Facts & Dimensions:
•Y-axis [units]: Gross Volume
•Colors by: Device Class
•X-axis [date]: Year Month
Effective processing time by device class and year
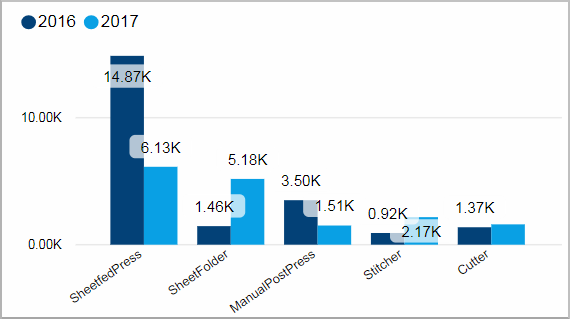
Facts & Dimensions:
•Y-axis [h]: Effective Processing Time (h)
•Colors by: Year
•X-axis: Device Class
Effective processing time by month and device class
Facts & Dimensions:
•Y-axis [h]: Effective Processing Time (h)
•Colors by: Device Class
•X-axis [date]: Year Month