(Change language of this page to: English, Deutsch)
....
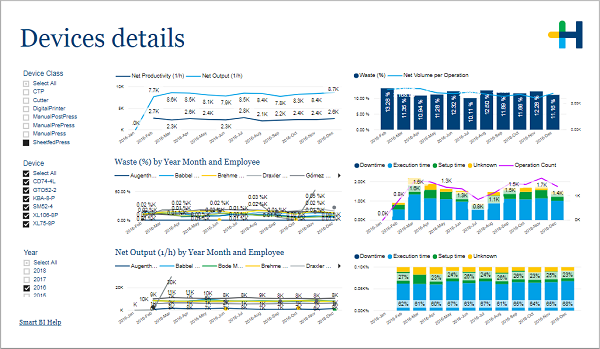
In the filter area on the left you can adjust which devices and years are included in the charts.
•Net productivity per hour and net output per hour
•Waste percentage and net volume per operation
•Waste percentage by month and employee
•Execution time, setup time and operation count in absolute numbers
•Net Output by month and employee
•Execution time and setup time (percentage)
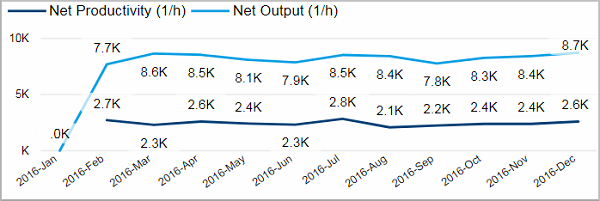
Net productivity per hour and net output per hour
Facts & Dimensions:
•Y-axis Dark blue line [units/h]: Net Productivity (1/h)
•Y-axis Light blue line [units/h]: Net Output (1/h)
•X-axis [date]: Year Month
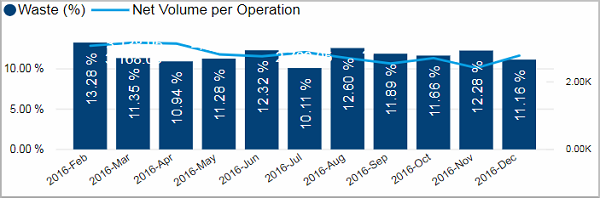
Waste percentage and net volume per operation
Facts & Dimensions:
•Y-axis Dark blue [%]: Waste (%)
•Y-axis (2nd) Light blue line [units]: Net Volume per Operation
•X-axis [date]: Year Month
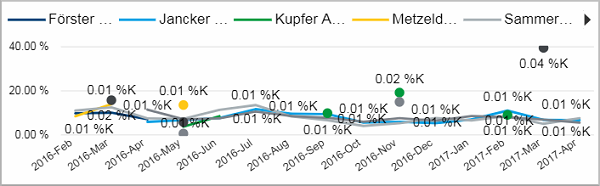
Waste percentage by month and employee
Facts & Dimensions:
•Y-axis [%]: Waste (%)
•Colors by: Employee
•X-axis [date]: Year Month
Execution time, setup time and operation count in absolute numbers
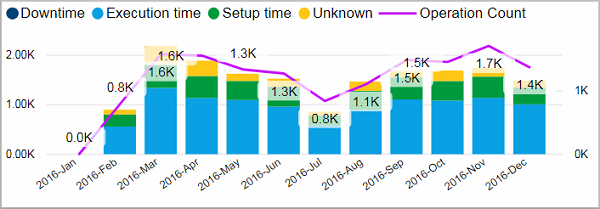
Facts & Dimensions:
•Y-axis [h]: Operating Time (h)
•Colors by: Time type
•Y-axis (2nd) Purple line: Operation Count
•X-axis [date]: Year Month
Net Output by month and employee
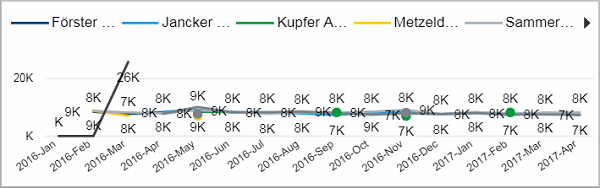
Facts & Dimensions:
•Y-axis [units/h]: Net Output (1/h)
•Colors by: Employee
•X-axis [date]: Year Month
Execution time and setup time (percentage)
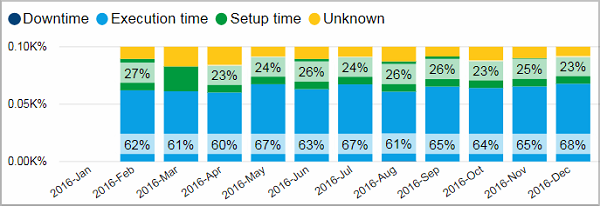
Facts & Dimensions:
•Y-axis [h]: Operating Time (h)
•Colors by: Time type
•X-axis [date]: Year Month