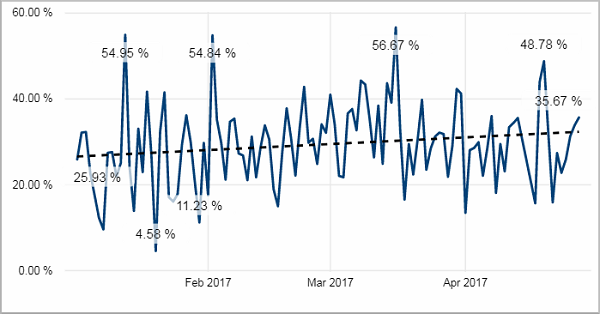
This chart shows you the OEE for each day in the selected time period. The dashed line marks the overall trend.
Facts & Dimensions:
•Y-axis [%]: OEE (%)
•X-axis [date]: Date
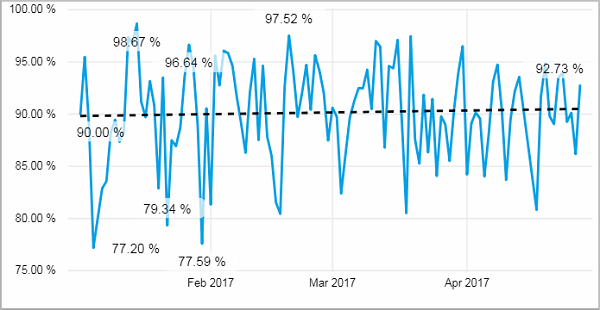
This chart shows you the Quality Index for each day in the selected time period. The dashed line marks the overall trend.
Facts & Dimensions:
•Y-axis [%]: Quality Index (%)
•X-axis [date]: Date
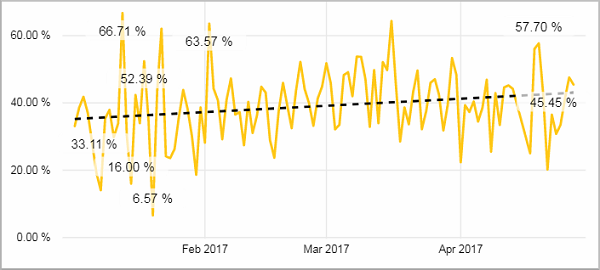
This chart shows you the Speed Index for each day in the selected time period. The dashed line marks the overall trend.
Facts & Dimensions:
•Y-axis [%]: Speed Index (%)
•X-axis [date]: Date
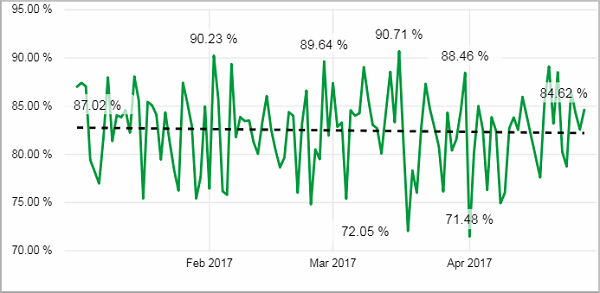
This chart shows you the Time Index for each day in the selected time period. The dashed line marks the overall trend.
Facts & Dimensions:
•Y-axis [%]: Time Index (%)
•X-axis [date]: Date