(Change language of this page to: English, Deutsch)
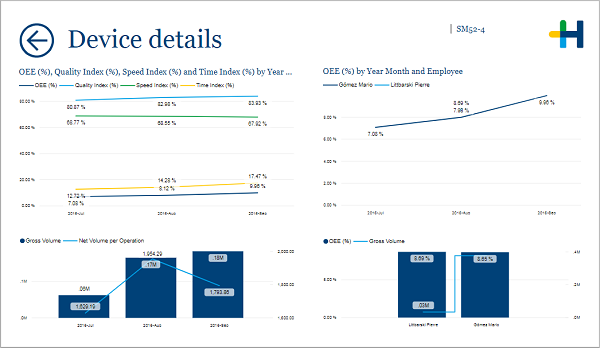
This page is accessible through drillthrough from several different pages and tiles in the report. It shows you detailed OEE results for a certain device.
The filter adjustments for time and device are transferred from the parent page.
In the first chart you can check the OEE and its components for each month. The chart below gives you the corresponding values for gross volume and net volume per operation.
The right half of this page deals with the operators. In the above chart you can see which employees operated this device and compare their OEE results. Below this you can see the operators with the best OEE results complemented with the gross volume that they produced on this machine.
OEE (%), Quality Index (%), Speed Index (%) and Time Index(%) by month
Facts & Dimensions:
•Y-axis Dark Blue line [%]: OEE (%)
•Y-axis Light Blue line [%]: Quality Index (%)
•Y-axis Green line [%]: Speed Index (%)
•Y-axis Yellow line [%]: Time Index (%)
•X-axis [date]: Year Month
OEE (%) by month and employee
Facts & Dimensions:
•Y-axis [%]: OEE (%)
•Colors by: Employee
•X-axis [date]: Year Month
Gross volume and net volume per operation
Facts & Dimensions:
•Y-axis [units]: Gross Volume
•Y-axis (2nd) [units]: Net Volume per Operation
•X-axis [date]: Year Month
OEE (%) and gross volume
Facts & Dimensions:
•Y-axis Dark blue [%]: OEE (%)
•Y-axis Light blue line [units]: Gross Volume
•X-axis: Employee