(Change language of this page to: English, Deutsch)
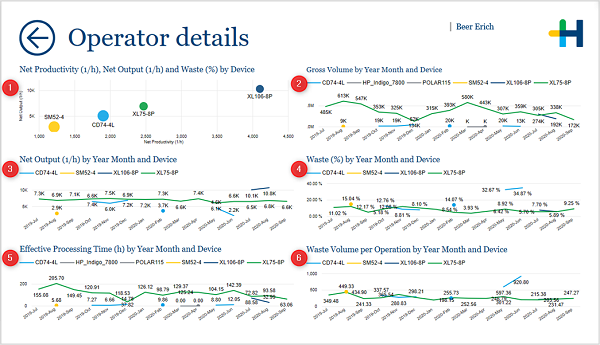
This page is accessible through drillthrough from several different pages and tiles in the report. It shows you detailed production results for a certain operator.
1. Net productivity per hour, net output per hour and waste percentage by device
Facts & Dimensions:
•Y-axis [units/h]: Net Output (1/h)
•Dots: Device
•Size by: Waste (%)
•X-axis [units/h]: Net Productivity (1/h)
2. Gross volume by month and device
Facts & Dimensions:
•Y-axis [units]: Gross Volume
•Colors by: Device
•X-axis [date]: Year Month
3. Net output per hour by month and device
Facts & Dimensions:
•Y-axis [units/h]: Net Output (1/h)
•Colors by: Device
•X-axis [date]: Year Month
4. Waste percentage by month and device
Facts & Dimensions:
•Y-axis [%]: Waste (%)
•Colors by: Device
•X-axis [date]: Year Month
5. Effective Processing Time (h) by month and device
Facts & Dimensions:
•Y-axis [h]: Effective Processing Time (h)
•Colors by: Device
•X-axis [date]: Year Month
6. Waste Volume per operation by month and device
Facts & Dimensions:
•Y-axis [units]: Waste Volume
•Colors by: Device
•X-axis [date]: Year Month