•Net productivity per hour by device class and year
•Net productivity per hour by month and device class
•Waste percentage by device class and year
•Waste percentage by month and device class
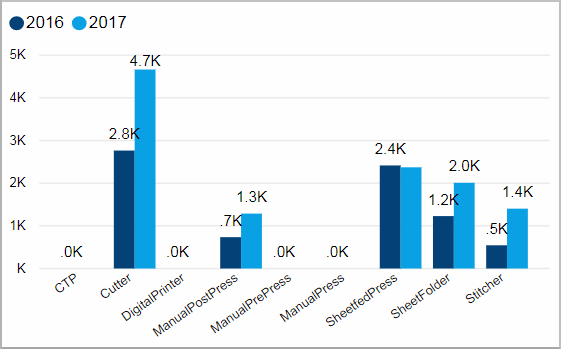
Net productivity per hour by device class and year
This chart shows you the net productivity per hour for device classes by year.
Facts & Dimensions:
•Y-axis [units/h]: Net Productivity (1/h)
•Colors by: Year
•X-axis: Device Class
Net productivity per hour by month and device class
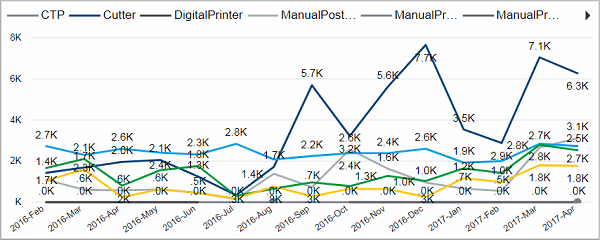
This chart shows you the course of the net productivity per hour for different device classes over months.
Facts & Dimensions:
•Y-axis [units/h]: Net Productivity (1/h)
•Colors by: Device Class
•X-axis [date]: Year Month
Waste percentage by device class and year
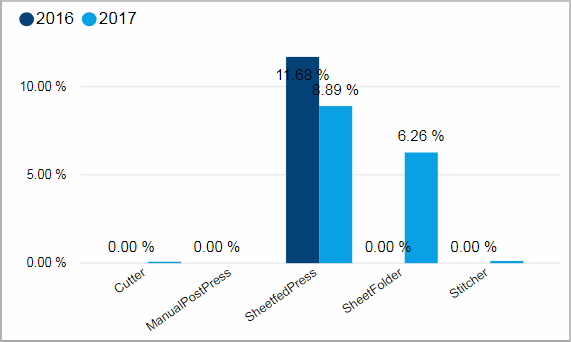
This chart shows you the waste percentage for device classes by year.
Facts & Dimensions:
•Y-axis [%]: Waste (%)
•Colors by: Year
•X-axis: Device Class
Waste percentage by month and device class
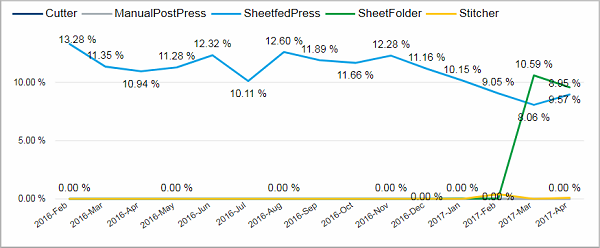
This chart shows you the course of the waste percentage for different device classes over months.
Facts & Dimensions:
•Y-axis [%]: Waste (%)
•Colors by: Device Class
•X-axis [date]: Year Month