How do key parameters depend on factors?
(Change language of this page to: English, Deutsch)
This page is accessible through drillthrough from several different pages and tiles in the report.
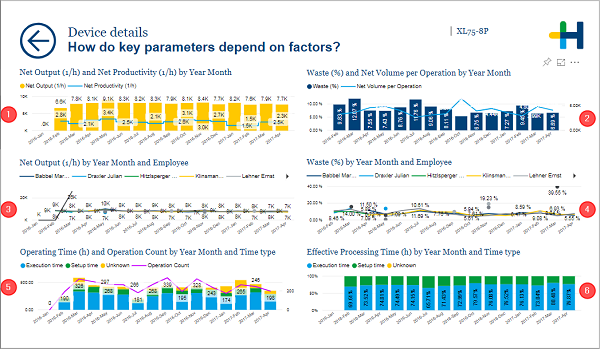
1. Net output per hour and net productivity per hour by month
Facts & Dimensions:
•Y-axis Yellow [units/h]: Net Output (1/h)
•Y-axis Light blue line [units/h]: Net Productivity (1/h)
•X-axis [date]: Year Month
2. Waste percentage and net volume per operation by month
Facts & Dimensions:
•Y-axis Dark blue [%]: Waste (%)
•Y-axis (2nd) Light blue line [units]: Net Volume per Operation
•X-axis [date]: Year Month
3. Net output per hour by month and employee
Facts & Dimensions:
·Y-axis [units/h]: Net Output (1/h)
·Colors by: Employee
·X-axis [date]: Year Month
4. Waste percentage by month and employee
Facts & Dimensions:
•Y-axis [%]: Waste (%)
•Colors by: Employee
•X-axis [date]: Year Month
5. Operating time and operation count by month and time type
Facts & Dimensions:
•Y-axis [h]: Operating Time (h)
•Colors by: Time type
•Y-axis (2nd) Purple line: Operation Count
•X-axis [date]: Year Month
6. Effective Processing Time (h) by month and time type
Facts & Dimensions:
•Y-axis [%]: Effective Processing Time (h)
•Colors by: Time type
•X-axis [date]: Year Month