•Invoiced Value and Invoiced Value PY by Year Month
•TOP Customers by Invoiced Value YTD YoY
•Bottom Customers by Invoiced Value YTD YoY
•Invoiced Value YTD YoY by Product Group
•Invoiced Value YTD YoY by Representative
•Invoiced Value YTD YoY by Customer Group
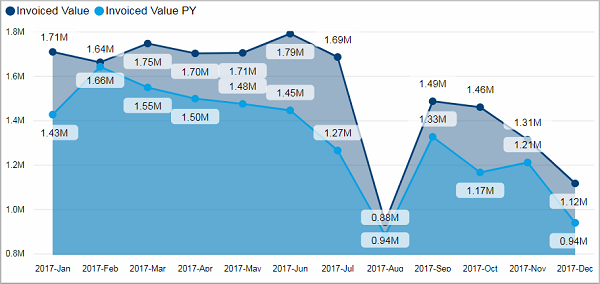
Invoiced Value and Invoiced Value PY by Year Month
Invoiced Value YTD compared with last year's Invoiced Value.
Facts & Dimensions:
·Y-axis Dark blue [currency]: Invoiced Value
·Y-axis Light blue [currency]: Invoiced Value PY
·X-axis [date]: Year Month
TOP Customers by Invoiced Value YTD YoY
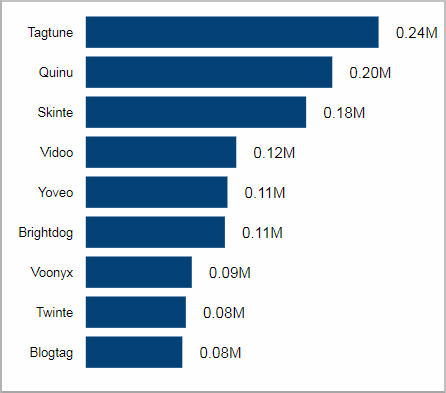
This visual shows the customers with the highest increase in invoiced value YTD compared with last years’ invoiced value YTD.
Facts & Dimensions:
·Y-axis: Customer
·X-axis [currency]: Invoiced Value YTD YoY
·Tooltip: Invoiced Value YTD YoY %
Drillthrough:
Bottom Customers by Invoiced Value YTD YoY
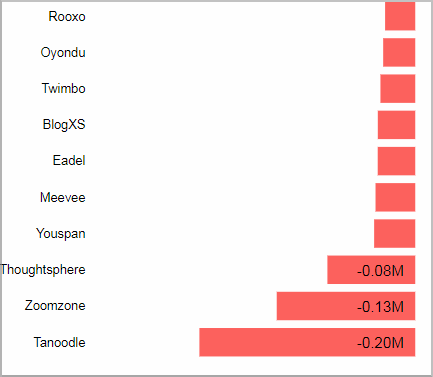
This visual shows the customers with the highest decrease in invoiced value YTD compared with last years’ invoiced value YTD.
Facts & Dimensions:
·Y-axis: Customer
·X-axis [currency]: Invoiced Value YTD YoY
·Tooltip: Invoiced Value YTD YoY %
Drillthrough:
Invoiced Value YTD YoY by Product Group
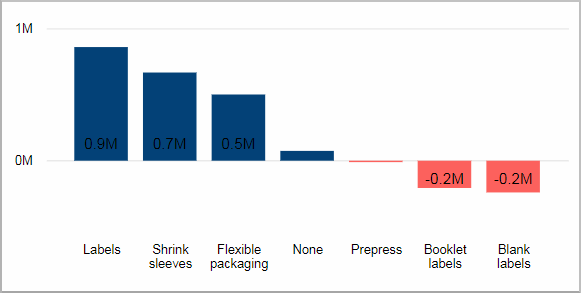
This visual shows the change in invoiced value YTD compared to last year for each product group. It is sorted by decreasing values.
Facts & Dimensions:
·Y-axis [currency]: Invoiced Value YTD YoY
·X-axis: Product Group
·Tooltip: Invoiced Value YTD YoY %
Drillthrough:
Invoiced Value YTD YoY by Representative
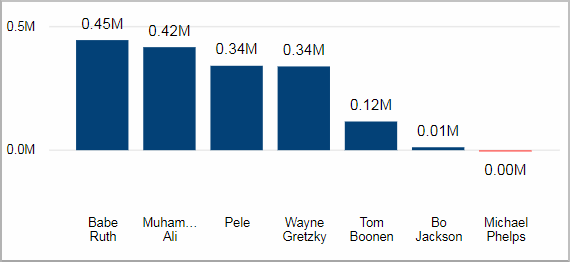
This visual shows the change in invoiced value YTD compared to last year for the current representatives. It is sorted by decreasing values.
Facts & Dimensions:
·Y-axis [currency]: Invoiced Value YTD YoY
·X-axis: Current Representative
·Tooltip: Invoiced Value YTD YoY %
Drillthrough:
Invoiced Value YTD YoY by Customer Group
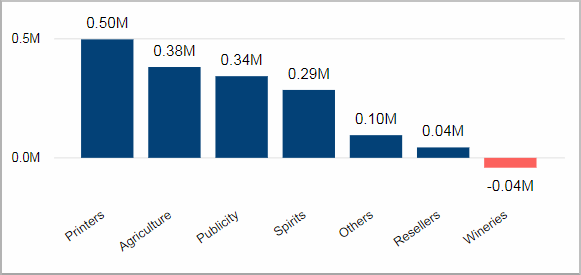
This visual shows the change in invoiced value YTD compared to last year for each product group. It is sorted by decreasing values.
Facts & Dimensions:
·Y-axis [currency]: Invoiced Value YTD YoY
·X-axis: Customer Group
·Tooltip: Invoiced Value YTD YoY %
Drillthrough:
HD Privacy Statement | Imprint | Prinect Know How