•Top Representative by Invoiced Value
•Top Product Group by Invoiced Value
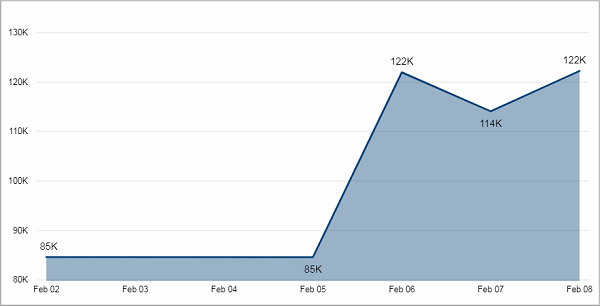
Invoiced Value based on Document Date over the last 30 days. (In this example the days were filtered to the first eight days of February).
Facts & Dimensions:
·Y-axis Dark blue [currency]: Invoiced Value
·X-axis [date]: Date
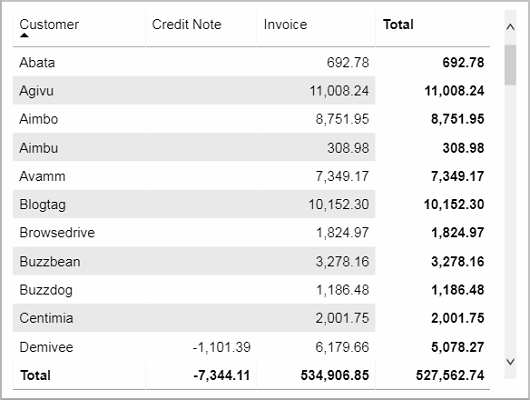
List of invoices with the total invoiced value.
Facts & Dimensions:
Drillthrough:
Top Representative by Invoiced Value
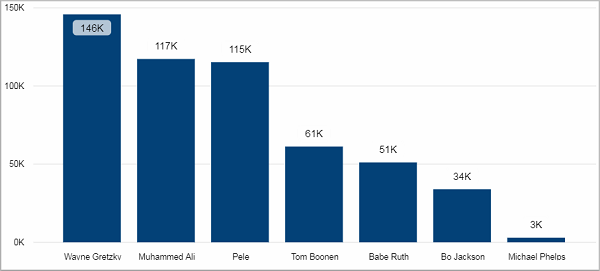
Invoiced Value per Customer Representative.
Facts & Dimensions:
·Y-axis [currency]: Invoiced Value
·X-axis: Current Representative
·Drill Down => X-axis: Customer
Top Product Group by Invoiced Value
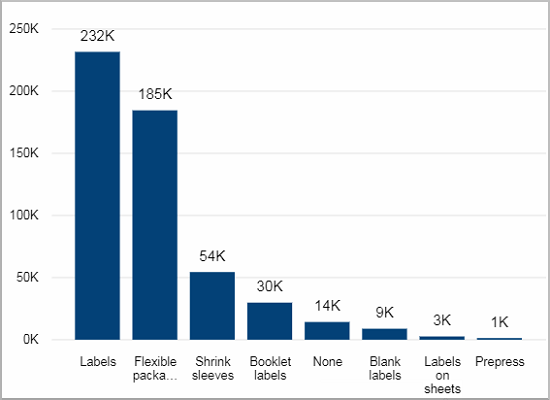
Invoiced Value per Product Group.
Facts & Dimensions:
·Y-axis [currency]: Invoiced Value
·X-axis: Product Group
Drillthrough:
HD Privacy Statement | Imprint | Prinect Know How