Labelfire Primefire
There are different test pages for each of the machines:
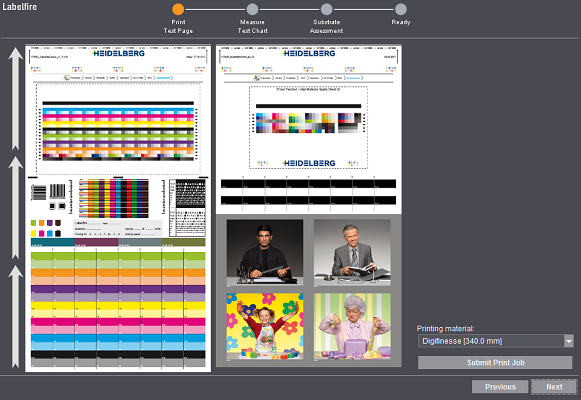
The test chart to be printed has two pages:
•Page 1:
The first page contains test patches for spot colors. You can measure and analyze how well they can be reproduced with the help of Prinect Color Toolbox.
•Page 2:
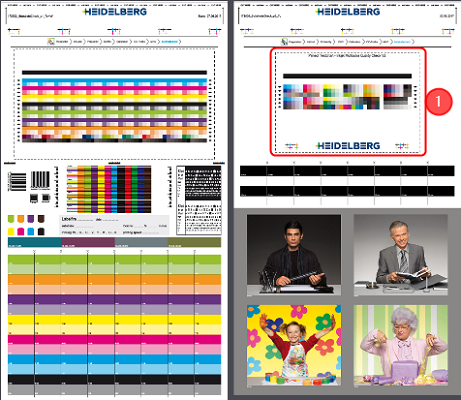
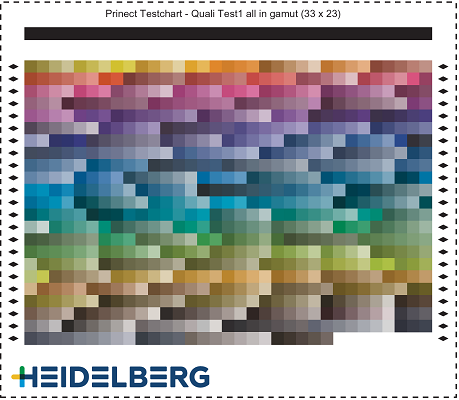
The second page contains the test chart [1] that will be measured in the next step. In the upper part of the test chart [1], primaries, secondaries and tertiaries are printed in tonal value scales to test the repeatability of these color values and, by doing so, the stability of the machine. In the lower part, color management and the stability of color reproduction is checked based on set Lab values.
Click "Submit Print Job" to print the test chart. The test chart is submitted to the Cockpit. This process can take some time.
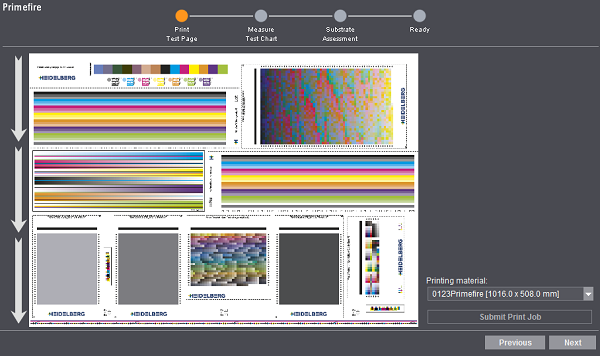
For the Primefire, different test charts are printed on one sheet. Check them visually or evaluate them with the Prinect Color Toolbox.
One of the test pages is to be measured in the next step. It is located on the sheet at the bottom right corner [10].
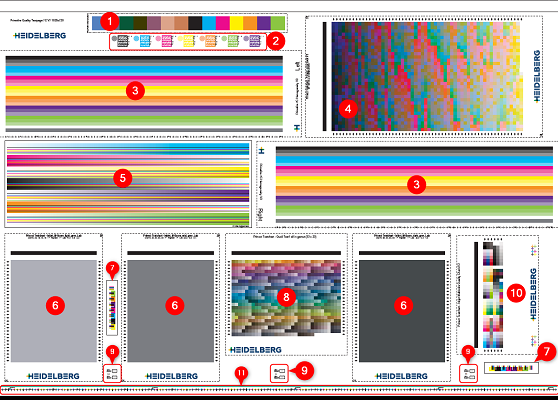
In the upper part of the test chart [10], primaries, secondaries and tertiaries are printed in tonal value scales to test the repeatability of these color values and, by doing so, the stability of the press. In the lower part, the stability of color reproduction is checked based on set Lab values.
The various areas on the test page will now be described briefly:
|
1 |

|
|
|
Test chart for checking the granularity. It has 14 color patches sized 25x25 mm. This test chart is assessed visually or using a scanner.
|
|
2 |

|
|
|
Test chart with small fonts. On this chart, text sizes 6 pt, 5 pt, 4 pt, 3 pt, 2 pt and 1 pt are printed in each device color.
|
|
3 |
|
|
|
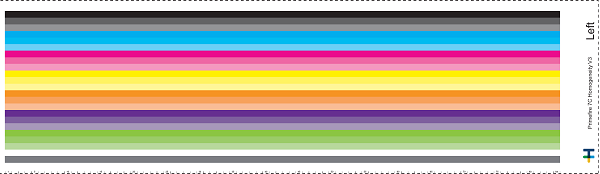
Two test charts ("Left" and "Right") for homogeneity across the whole width of the print. A homogeneous strip with 100%, 75% and 50% inking is printed for each device color. Below that there is a paper white strip and a gray strip. This test chart should be measured with Konica Minolta FD-9.
|
|
4 |
|
|
|
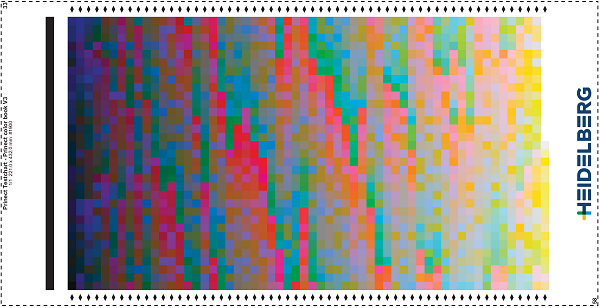
The "Prinect color book V3" test chart provides 1900 Lab color patches for analysis of the color space and the accuracy of the spot colors. This test chart should be measured with X-Rite i1iSis or Konica Minolta FD-9.
|
|
5 |
|
|
|
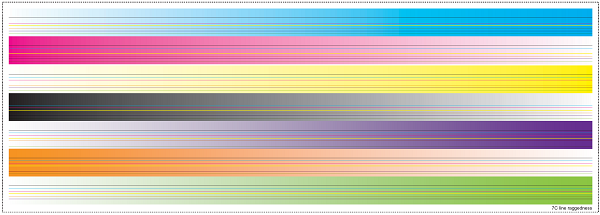
Test chart for checking intercolor bleeding. There is a strip with shading (inking from 0% to 100%) for each process color. Homogeneous lines 0.02 mm wide in each process color run through each of these strips. Using a magnifying glass, check whether the lines are fringed or not.
|
|
6 |
|
|
|
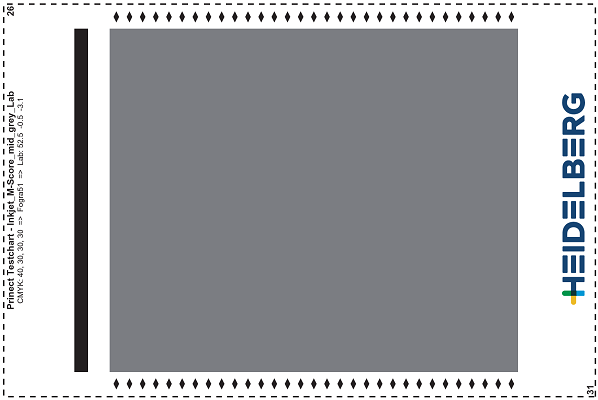
Three test charts for examining the macro uniformity of the print job compliant with ISO "Macro-Uniformity Score". They consist of light gray, medium gray and dark gray areas. The CMYK values were converted to Lab values before printing with Fogra 51. The test charts can be measured with X-Rite i1iSis or Konica Minolta FD-9.
|
|
7 |

|
|
|
Test chart for examining intercolor bleeding. Lines, 0.02 mm thin, in all process colors jut into the various color patches (100% device color). Using a magnifying glass, examine the transition between white (or substrate background) and color. Are the lines restricted? Do the lines run or are they thicker?
|
|
8 |
|
|
|
Test chart for checking the accuracy of the Lab spot colors. This test chart should be measured with X-Rite i1iSis or Konica Minolta FD-9.
|
|
9 |
|
|
|
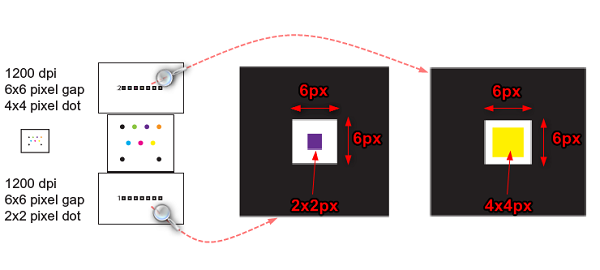
Test chart for checking register accuracy. It consists of two rows, each with seven black squares (one for each process color). There is a 6 x 6 pixel gap in the middle of each square. A dot in the process color of the square is printed in it. The dot is 4 x 4 pixels big in the top row and 2 x 2 pixels big in the bottom row. Using a magnifier, check how accurately this dot lies in the middle of the square. This test chart is found three times on the sheet. |
|
10 |
|
|
|
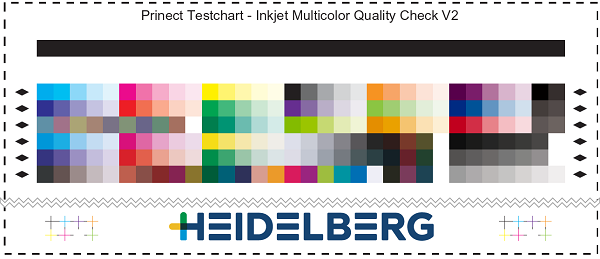
"Multicolor Quality Check" test chart for checking the machine stability and color management. This test chart is measured in the next step. |
|
11 |

|
|
|
Test chart with short, vertical lines in each device color, distributed in such a way that the position of the 25 print heads is covered. If the sheet runs through the middle of the machine, you can check the position of the single print heads.
|
If you have the printed test chart, click "Next".