Labelfire Primefire
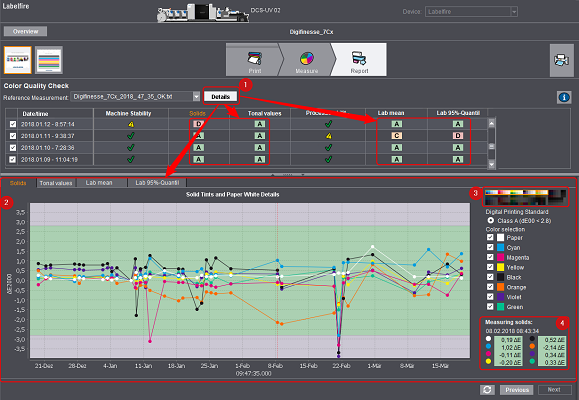
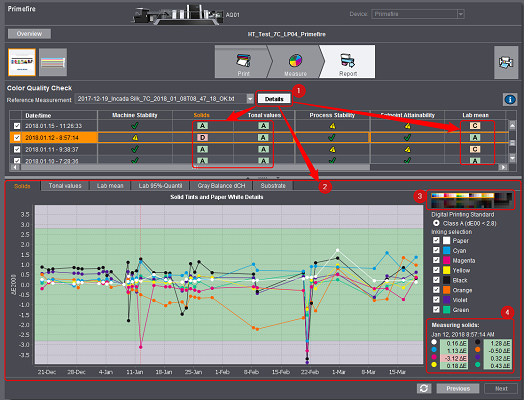
When you enable "Details" [1], more columns appear in the table and also a graphic view with several tabs.
In contrast to the simple view, the table has more columns that explain more precisely what the assessments for "Machine Stability" and "Setpoint Attainability" (Primefire only) consist of.
The "Solids" and "Tonal values" columns show in addition to "Machine Stability".
Only for Primefire: "Setpoint Attainability" is made up of "Lab mean", "Lab 95% Quantile", "Gray Balance dCH" and "Substrate".
The table shows the tolerance classes ("A" to "D") of the measurement results. If all the results are class A, "Machine Stability” or "Setpoint Attainability" then has a checkmark. However, if at least one value falls into a lower class, the cell concerned is then tagged by a yellow warning triangle.
To learn more about a measured value, click the cell concerned with the tolerance class. The correct diagram tab opens automatically and the measure point is indicated by a red crosshair. Vice versa, you can also click a dot in the graphic, and the related row in the table is then highlighted automatically.
Diagrams
In the diagram, you can display the trend of the measurement results as a graph. Various tabs are available to you for this:
•Solids
Deviations of each of the process colors from the reference file.
•Tonal values
During printing of the single screen dots, the print dots may be deformed, something that is reflected in an altered lightness. This diagram shows the dot gain for tonal values of 40% and 70%.
•Lab mean
Mean of the deviations from the Lab reference values.
•Lab 95% Quantile
95% quantile of the deviations from the Lab reference values. The 95% quantile is the ΔE00 value below which 95% of all measured data are found.
•Lab mean (Primefire only)
Mean deviation from the Lab setpoints.
•Lab 95% Quantile (Primefire only)
Because the mean deviation can be falsified by single outliers, you can view the 95% quantile of the deviations from the Lab setpoints in this tab. The 95% quantile is the ΔE00 value below which 95% of all measured data are found.
•Gray Balance dCH (Primefire only)
Maximum dCH deviations for multicolor grays.
•Substrate (Primefire only)
ΔE00 deviation of paper white from the FOGRA 51 reference sheet (L=95.0, a=1.5, b=-6.0).
The tabs generally contain the following information:
The date of measurement displays on the x axis of the diagram, while the y axis shows the ΔE00 deviation from the reference measurement or the dot gain.
The tolerance classes can be seen as colored backgrounds in the graphic window. All the measured data within the green area meet tolerance class A.
When you click a measure point, the exact values then display to the right of the graphic. In addition, the related row is highlighted in the table.
To zoom in an area of the graphic window, draw a frame around this area with the mouse button pressed. To return to the overview, click the left mouse button inside the graphic window and move the mouse slightly to the left while holding the mouse button pressed.
You can resize the whole graphic area by clicking the light gray bar [2] and dragging it up or down with the mouse.
To the right of the graphic window, you will find more details and controls to resize the graphic view:
Test chart
The color patches that were measured for the graphic view shown are marked in the small view of the test chart [3].
Digital Printing Standard
This is where you select how big the green area will be in the graphic. Is it to be only within the limits of tolerance class A or are values within class B or C also to be within the green area?
The "Class A-C" option shows the color graduations of the classes.
Color Selection
This is where you can show and hide the display of each of the process colors.
Measurement result
You can view the date and the exact values of the marked measure point at the very bottom of the pane.