Labelfire Primefire
In this tab you can check the homogeneity across the entire printing width.
The test charts for checking the homogeneity consist of single-color strips that are measured across the whole width with the spectrophotometer.
The table lists the date of all previous measurements and their results for the tonal values 100% (Solids), 75% and 50%. A green checkmark indicates that the measured values were OK, i.e. they remained within tolerance class A.
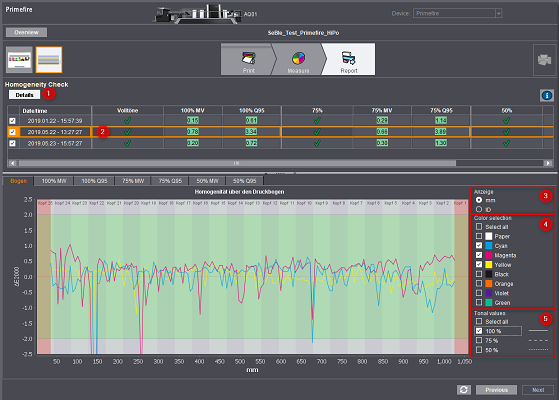
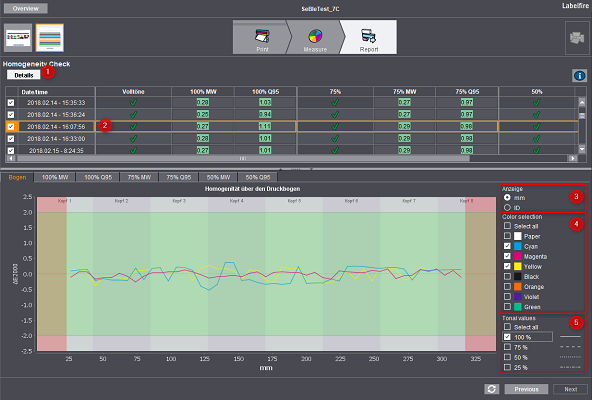
Click the "Details" button [1] to examine the measurement results in more detail. The table is now expanded by the mean value and the 95% quantile for each tonal value, and a graphic area displays below it.
In the "Sheet" tab, evaluation of the selected sheet displays across the full width of the test chart. The other tabs provide a long-term evaluation of all measurements as a mean value or 95% quantile, for each color in the tonal values 100%, 75% and 50%.
"Sheet" tab
Use this graphic to assess the homogeneity of the area coverage across the entire sheet width.
In the table, mark the measurement [2] whose results are to display in the diagram.
In [3], you set the labeling of the x axis:
•mm
The x axis is equivalent to the distance of the measure point from the edge of the test chart in millimeters. The position of the print heads also displays. These positions are correct only for sheets that run "centered" through the machine.
•ID
The x axis displays the ID of the test chart patches.
The ΔE00 difference in color of the measure point to the mean is entered across the whole sheet width on the y axis.
On the right, you can show and hide the display of each of the colors in "Color Selection" [4]. In addition, you can also check paper white.
Strips with tonal values of 25% (Labelfire only), 50%, 75% and 100% for each process color are found on the test chart. You can select which of them will be shown in "Tonal values" [5].
"MV" and "Q95" tabs
The remaining tabs all have the same structure and show the mean value of the color deviation or the 95% quantile for the different tonal values over time for all measurements. The 95% quantile is the ΔE00 value below which 95% of all measured data are found.