
Re-Linearization by Measurement
For more information on when you need to perform a re-linearization, please refer to When and why is a base or re-linearization necessary?.
During re-linearization, the tonal density is matched to the density of the reference printer on which the medium profile was generated. This ensures that the color reproduction properties remain constant.
When you re-linearize the printer by measurement, the ink density in the base linearization file is optimized.
As a rule, you should re-linearize every two weeks.
Automatic Re-Linearization with an External Measuring Device
Prerequisite: The following requirements must be met:
·The measuring device must be connected and ready for operation.
·A base linearization file (.epl file) must be available.


1.Click "Re-Linearization by Measurement" in the Color Proof Pro start window.
The dialog "Please select an output device" opens:

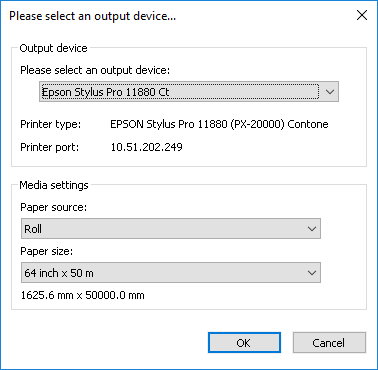
2.Select the printer that you want to re-linearize.
If applicable, specify the paper source and size.
3.Confirm the dialog with "OK". The "Re-Linearize Printer" view opens.

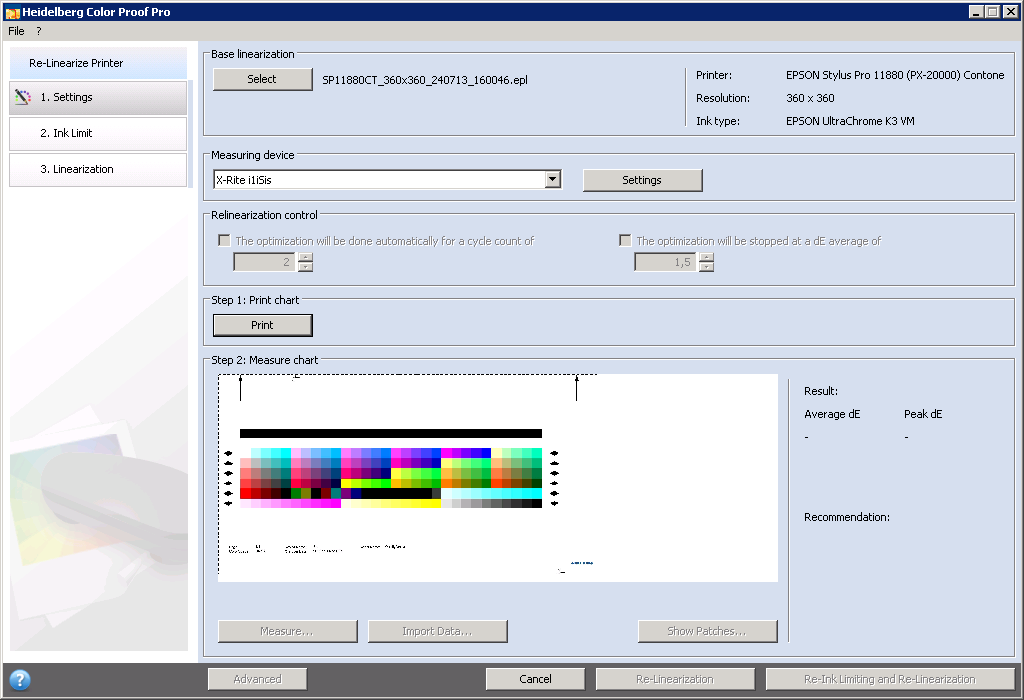
4.In "Base linearization", select the base linearization file (.epl file) created beforehand.

Prerequisite: Please note that the .epl file must have been generated with the currently selected printer. In addition, the base linearization file must be connected to a paper profile (see Connect Profiles). If not, an error message will appear.
5.Select the measuring device. In our example, it is the "X-Rite i1iSis".
6.If necessary, click "Settings" to make additional device-specific settings for the measuring device. This option is not available for all measuring devices.

Note: If your printer features an integrated UV Cut measuring device, you can enable the respective option to simulate a non-UV Cut measuring device. In Europe, non-UV color data is used predominantly for proofing.
The window now shows the appropriate test chart.
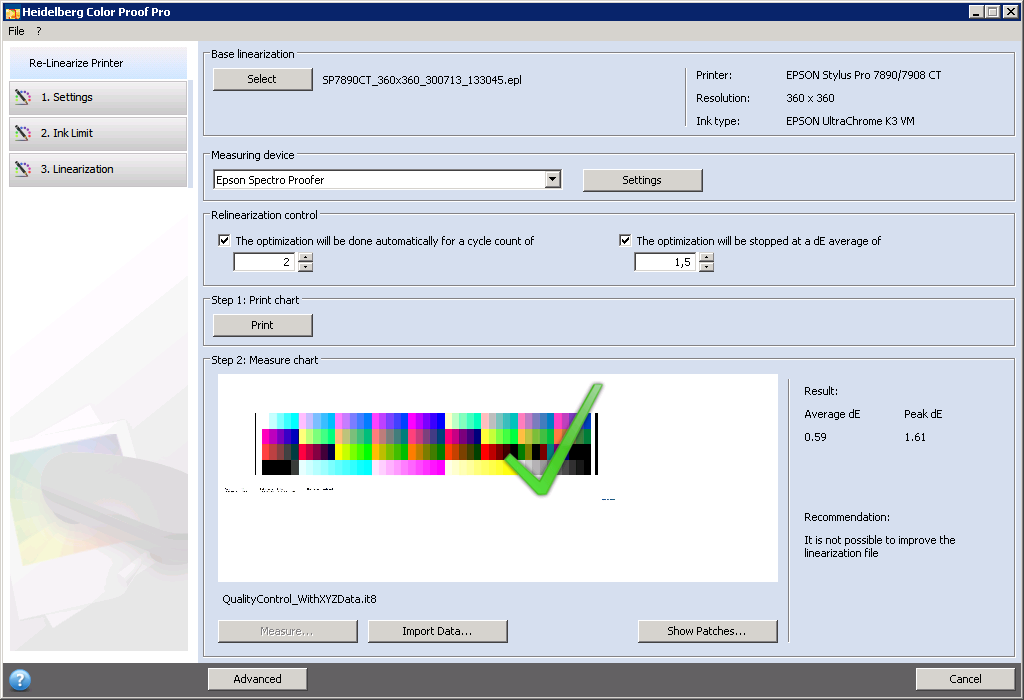
Group "Relinearization control"
This group is only active for printers that feature an integrated measuring device (such as Epson Stylus Pro 7900 with Spectro Proofer).
Optimization can be performed automatically with this kind of printer. For this purpose, enable the option "The optimization will be done automatically for a cycle count of" and specify the number of cycles. The optimization will then be repeated automatically until the specified number of cycles has been reached.
When you enable the option "The optimization will be stopped at a dE average of" and specify a Delta E value, the measurement — independent of the number of specified cycles — will be stopped when the specified Delta E value is reached or fallen below.
The measurement stops if the specified Delta E-value is not reached after the specified number of cycles. In this case, you must repeat the measurement with another value, if applicable.
Each optimization cycle is done in two steps:
•print chart and
•measure chart.
If necessary, this cycle must be repeated several times until the Delta E target values are reached.
Step 1: Print chart
7.Click "Print".
Step 2: Measure chart
8.Click "Measure".
Load the trimmed test chart into the measuring device and click "Measure". During this step, the 100% ink limits are matched to those of the base linearization file. After measuring, the test chart is displayed.


You can select two rows of patches each in the upper part of the window. They appear separately in the bottom part.
When you hover the mouse pointer over a color patch, the L*a*b value of the respective color patch is shown in a tooltip.
Click "Next" to close the window.
During this step, the measured ink limits are compared with those of the base linearization file. The intermediate ink limit values (20%, 40% etc.) are matched to those of the base linearization file. The 100% ink limits are not affected.
The view immediately changes to the "Ink Limit" view if further optimization cycles are required because of too great deviations:

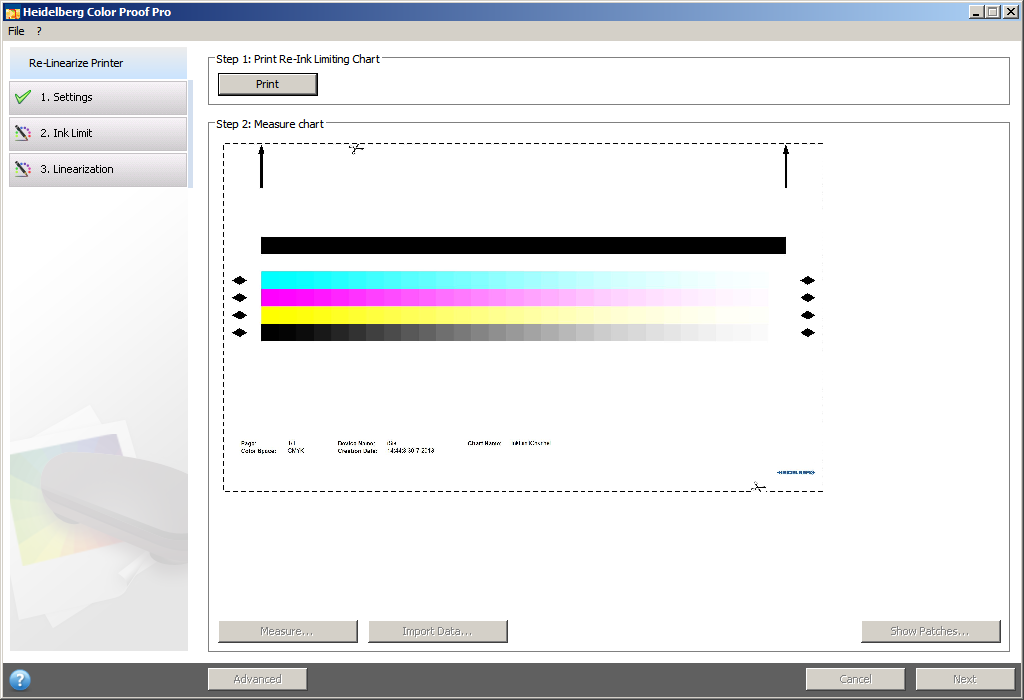
Repeat the "Print" and "Measure" steps as described above.
The view then changes to the "Linearization" step:

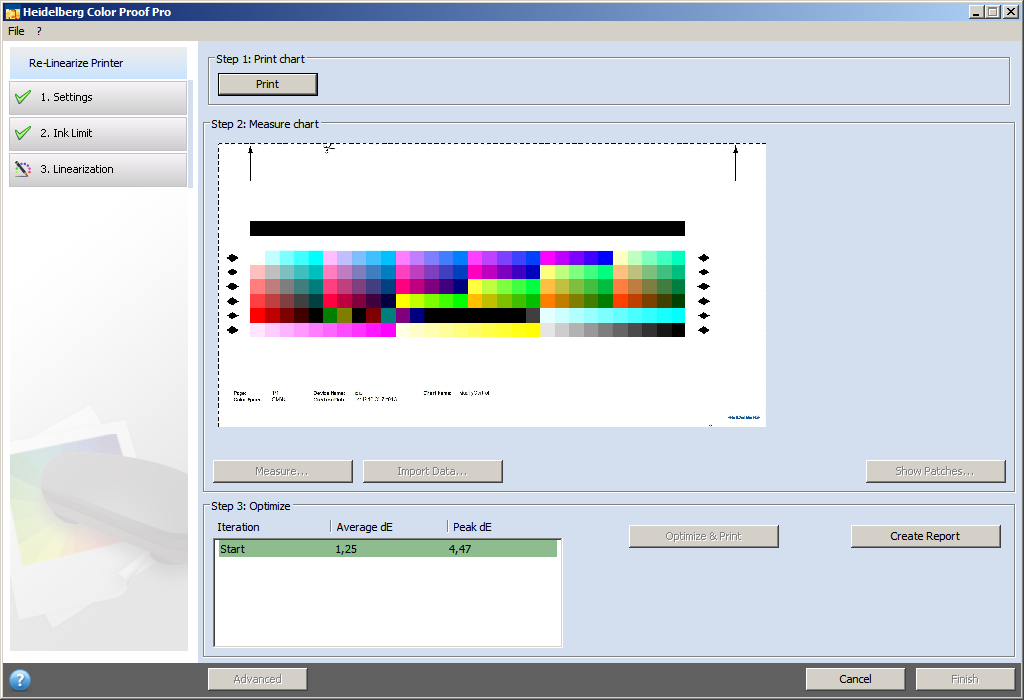
Repeat the "Print" and "Measure" steps as described above.
The "Step 3: Optimize" group displays the Delta E values "Average dE" and "Peak dE". The "Optimize & Print" button is active if further optimization iterations are required.
If necessary, perform further optimization iterations by running the following steps in succession:
·Click "Optimize & Print". Wait for the ink to dry and trim the test chart.
·Load the test chart into the measuring device and click "Measure".
The "Step 3: Optimize" group displays the updated Delta E values:

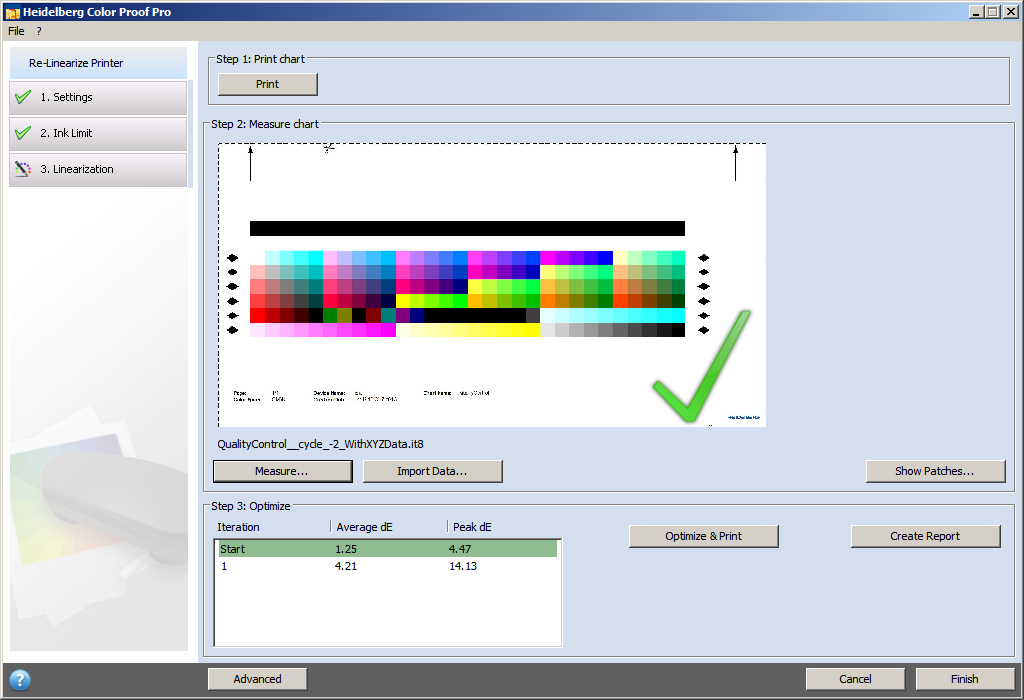
Further optimization is possible. Click "Optimize & Print" to repeat re-linearization. You can repeat this as often as you want. The best result is highlighted in green in the optimization table if you run several test series.
You can do one of the following before proceeding:
·Click "Advanced" to show a comparison of L*a*b and Delta E results. Click "OK" to return to the "Settings" window.
·Click "Show Patches" and hover the mouse pointer over a color patch to display the L*a*b value. The current color patches can be displayed at any time during re-linearization.
·Click "Import Data" to import existing measured data such as data determined with a measuring device not supported in Color Proof Pro. This data is used as basis for a new base linearization file. You can import data at any time during re-linearization.
Re-linearization is complete if the Delta E values are OK.
Create report
You can print a report containing the settings used to create the re-linearization file.
A report on the linearization process displays in the standard browser when you click "Create Report":

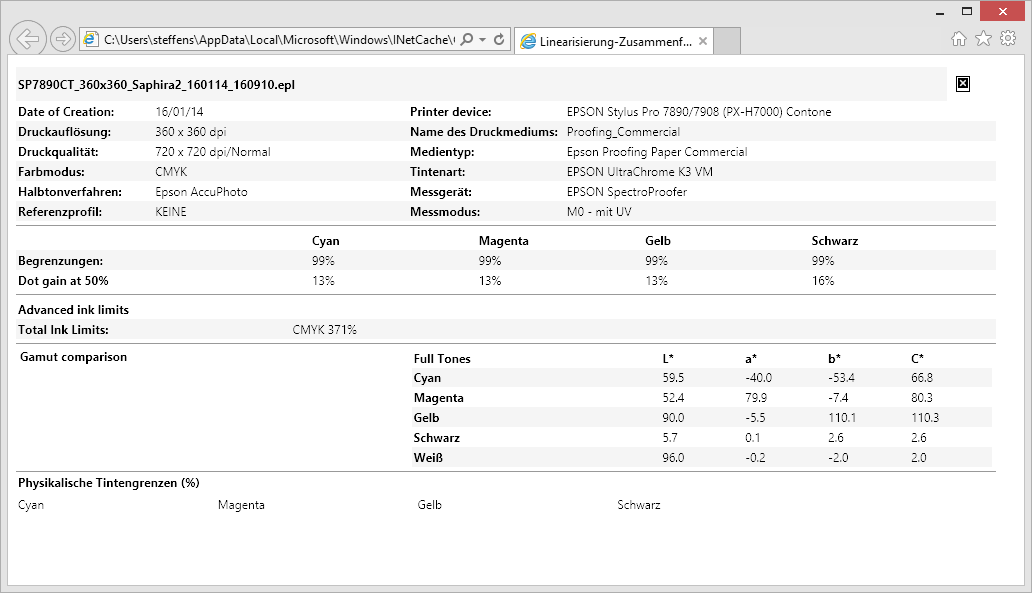
You can print the report using the print functions of the browser.
To complete the re-linearization, click "Finish". The Re-Linearization window closes.
You can overwrite the current base linearization file or create a new base linearization file by saving the results with a new name.
You can now select the new base linearization file in Color Proof Pro. You will find more details about this in the Online Help.
Automatic Re-Linearization with an Integrated Measuring Device
For automatic measurement (at least one of the options in the "Re-linearization control" groups enabled), the test chart is measured automatically when the drying time specified in the printer settings has expired. The result of the measurement is shown to the right of the printed test chart as well as a recommendation for further processing.
If necessary, set other values in the "Relinearization control" groups — e.g. for the target dE value — and click "Print". The automatic optimization process starts again.