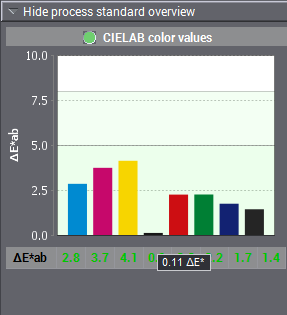
This is where you compare the measured solid tint CIELab values for the primary and secondary colors (black, cyan, magenta, yellow, red, green and blue) and also for CMY gray (Overprint) with the standard CIELb color values of the selected process standard. The deviation between the current measured data (actual values) and the respective process standard data (nominal values) is color distance ΔE and is shown by a bar graph.
The deviation for the secondary colors and overprint (CMY Gray) only displays if these colors are enabled in the process standard. The standard values for them are difficult to comply with technically and they are enabled only in more recent, improved process standards (see Working with 'Process standard').
Paper white is shown separately because the tolerances for the L, a and b values can differ (see 'Substrate' View).
A colored area indicates the tolerance that is typical for the process.
The current ΔE value for a color in the bar graph displays when you point the mouse to this bar.
The color distance calculated using the currently valid "ΔEab" definition (1976) displays for each color below the bar graph.

The following values appear when you point the mouse to a ΔE value:
•measured Lab value (actual value)
•Lab value of the process standard
•color distance calculated using the currently valid "ΔEab" definition (1976) (see bar graph)
•color distance calculated using the more recent "ΔE00" definition (2000). This ΔE value is much more accurate.
•tolerance "ΔETol" defined in the process standard