What's New?
What's New and Enhanced in the Prinect Color Toolbox?
In this chapter, we would like to highlight to you briefly the main enhancements and changes in the current Prinect Color Toolbox. The blue links will take you directly to more details on the topics.
New Features in Version 2019 of the Prinect Color Toolbox
Optimized profile calculation
Profile calculation was enhanced, making calculation noticeably shorter especially with extensive Multicolor profiles.
Process standards
•New process standards 2016 for offset, proof and digital
For details, see Process Standards for 2016.
Measure & evaluate
•The restrictions when measuring the P2P25 and P2P51 control strips (select via "User defined", mirrored preview) no longer exist. You can now select the control strips in the "New measurement file" dialog directly in "Control strip", with the preview oriented correctly.
You can measure P2P51 with the X-Rite i1 iO, X-Rite i1 iSis and Konica-Minolta FD-9. The results are evaluated in compliance with the G7 guidelines and can be used for gray balance calibration.
•New view, "NPDC (G7)"
"NPDC" stands for "Neutral Print Density Curve".
The view is active only if a G7 process standard is set.
At present, G7-P2P51 can be used as test charts.
For details, see 'NPDC (G7)' View.
•New released measuring device, Techkon SpectroDens NG.
Restriction: In the scan mode with the ColorScout A+, the SpectroDens NG can be used only for measuring IT 8.7/4 test charts.
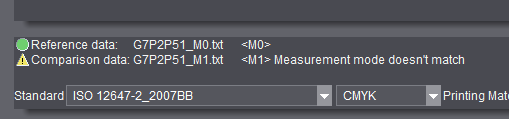
•Warning when comparing measured data with a different measurement condition
If you open color data sets in "Compare" whose reference and comparison file were measured with different measurement conditions, a warning displays in the footer, telling you that the measurement conditions do not match:
New functions in the "Tools" menu
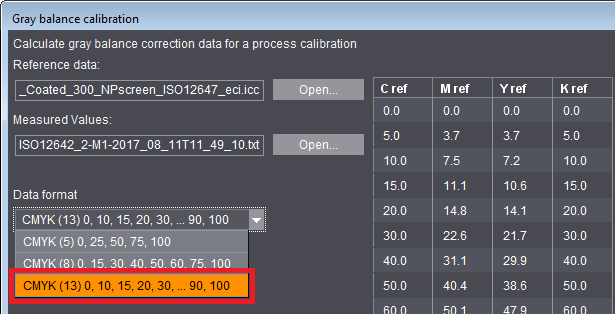
•Gray balance calibration
For the correction data format of gray balance calibration, you can now also select 13 coordinates in addition to the 5 or 8 coordinates possible to date. This format was enhanced especially by coordinates for highlights and shadows, something that can be important particularly for stochastic screens. See also Calculate correction data.
New test charts
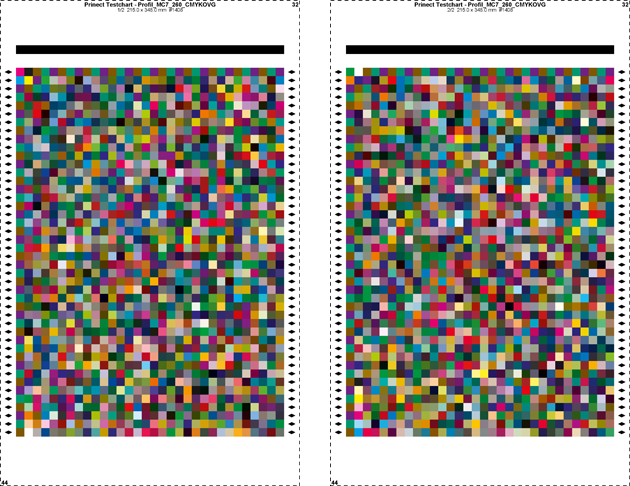
•Multicolor test chart 7-C "PrintOpen MC7 260 CMYKOGV" with 2x 1408 color patches.
New test chart with restricted total area coverage for enhanced scanning of the area used, suited especially for creating profiles for Primefire and Labelfire (see also Multicolor Test Charts).
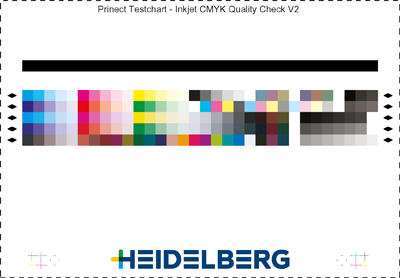
•Quality Check
New control strips for print quality control on inkjet machines like Primefire or Labelfire, either for CMYK or Multicolor (see also CMYK / MC7 Quality Check).
What's new in the Online Help
•Video tutorial on measuring with the Konica Minolta FD-9:
Color Toolbox & Konica Minolta FD-9
•Video tutorial on using serial measurements and analysis:
Serial measurement for analysis with CMYK Quality Check as an example

Note: The new process standards 2016 for offset, proof and digital and the "NPDC (G7)" view are available also for version 2018 via an update. This is valid also for the use of the P2P51 and TC1617 test charts for G7.
New Features in Version 2018 of Prinect Color Toolbox
In this chapter, we would like to highlight to you briefly the main enhancements and changes in the current Prinect Color Toolbox. The blue links will take you directly to more details on the topics.
New released measuring devices
•Konica Minolta FD-9 automatic measuring device
Test charts of up to 330 x 1500 mm and with a maximum thickness of 1 mm can be measured automatically with the FD-9 (see Konica Minolta FD-9).
•Techkon NG in the automatic "ColorScout A+ xy measuring table".
New functions in the "Tools" menu
•DeviceLink profile: additional option for matching the lightness curve when preserving colors (see Customize lightness curve)
•3D spot color view: Use the "Manual" setting to check the location of a single spot color in relation to the color gamut (see 3D spot color view).
Process standards
•Duplication of process standards (see Duplicate process standard); both single process standards as well as complete groups can be duplicated.
Other
•New test charts TC1617 (X-Rite G7) can be used
The test charts can be measured with the i1 iSis (see 'TC1617' (X-Rite G7) Test Charts).
•New linearization strips especially for checking the print results of the Versafire (see Overview of the Linearization Strips).
•Export of color tables as test charts from the PDF Toolbox: You can create whole color tables in the PDF Toolbox as test charts and export the related data file at the same time to the Color Toolbox.
What's new in the Online Help
•More video tutorials on the following subjects:
Create and analyze spot color strips
Export color tables as test charts
Check spot color locations in target color space in 3D diagram