
You can open this view by clicking the "Test chart" tab.
Display of the test chart
The view allows a visual comparison of both data sets and is particularly suited to checking measured color data. The test chart and/or control element is shown as color patches in the diagram. To the right of the diagram, you can define various settings for displaying the test chart or test strip.
Display
You can display the reference and comparison data either separately or together by checking the appropriate boxes.
Analysis
The following values are used for the evaluation:
•the values that were measured (XYZ values, Lab values)
•the difference of the measured values (ΔL, Δa, Δb) and the color distance (ΔE).
If you have measured color data, you can view the patches either with absolute or differential values (select in "Analysis"). Other settings are possible, depending on what you select in this box.
Note: It is not possible to display differential values for density values or screen percents.
Diagram
You can select three different diagrams for an analysis with differential values:
•View with miscolors
•View with miscolors (scaled up threefold)
•View with color differences
Parameters
You can select the following parameters to view the test chart with absolute or differential values:
•"ΔE(ab)", "ΔE(2000)": Color differences relating to Lab color values, calculation based on different definitions for color distances
•"ΔL*", "Δa*", "Δb*": Lab differential values of reference and comparison data
•"ΔC", "Δh": Chroma and hue difference
Color deviation
Color deviation is calculated for various parameters that you can select and the following data are shown:
•Mean
•StdDev = Standard deviation
•Max = maximum deviation value
•Patch (Max) = patch number of maximum deviation
Mark all patches with
When you enable this function, you can use the slider to set a value for the differential values for the parameter selected (e.g. ΔE(ab)). In this case, all patches whose differential value exceeds this value (e.g. 10) are marked by a red-and-white frame. All the patches are marked if you push the slider to the far right to 0.00.
View with Absolute Values and Marked Patches
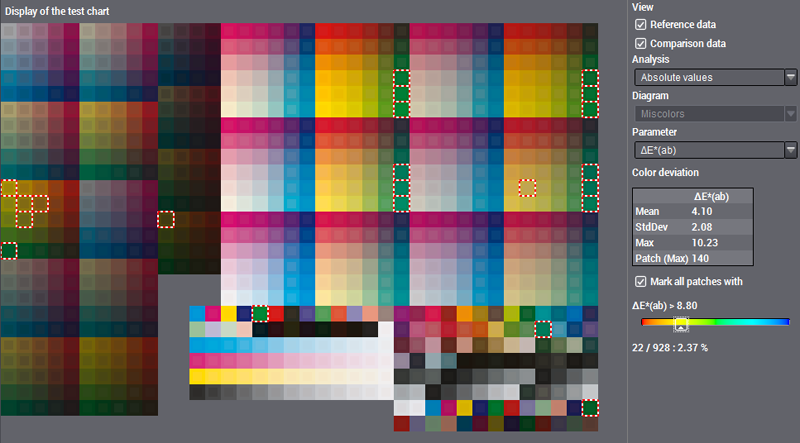
The patches can be shown together or individually. When both reference and comparison data are checked, the reference data are depicted by large patches and the comparison data by smaller ones on top of them.
The accuracy of the color data displayed on the monitor depends on the position of the colors in the color space and the monitor settings.
The ΔE value denotes the distance between two colors in the color space. Under favorable viewing conditions, a ΔE value of 1 to 2 is barely perceptible to the human eye. In grays, however, a finer differentiation is possible, allowing a ΔE value of 0.7 to be perceived in this range.
Viewing the differential values with miscolors is recommended for a visual comparison.
In this example, all patches whose ΔE(ab) value is greater than 10 are marked.
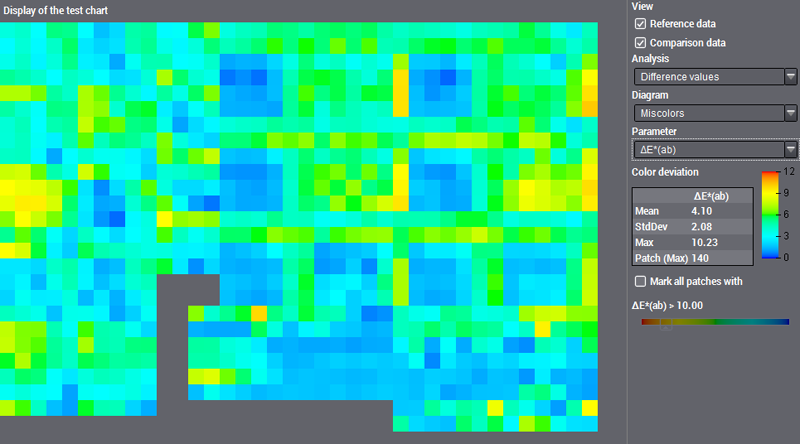
Viewing the data with differential values is suited to localizing errors as you can easily see any deviations. Differential values can be calculated and displayed for different parameters (color difference ΔE, differences of the L*, a* and b* coordinates, chroma or hue difference). The default view is with miscolors. These are used instead of the "real" colors to highlight slight differences in colors (especially grays).
A color scale with a range of 0 to 12 shows the meaning of the colors. For example, the biggest differences (ΔE greater than or equal to 12) are red and the smallest blue. Differences lying in between this are orange, yellow or green.
Diagram > Enhance miscolors
The miscolors display can also be scaled up threefold to be able to see smaller differences better. The scale range changes from 0 to 4 if you enable the "Enhance miscolors" option.
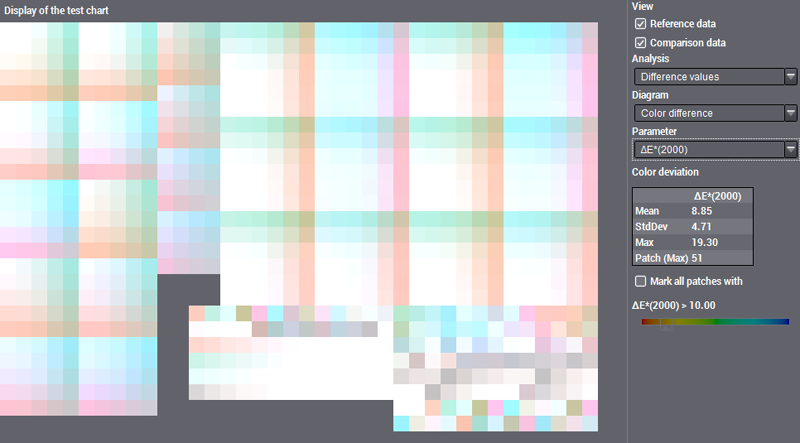
Diagram > Color difference
You can also switch over to view the color differences instead of the miscolors. These differences are difficult to recognize if the deviations are very small, and as a result you see "white" patches.
Data window
A separate window with the following data and reference values displays when you move the mouse pointer to a patch:
•"Field": Displays information about the current patch in the test chart or the control element
·"ID" = patch number, e.g. "N 18"
·"No." = patch number, e.g. "205"
·"x" = column number, e.g. "18"
·"y" = row number, e.g. "14"
•"Ref. [%]": Displays cyan, magenta, yellow, and black screen percents for the current patch.
•"Ref. [Lab]": Displays the Lab color values for the current patch of the reference data set
•Cmp. (beside "Ref. [Lab]"): Displays the Lab color values for the current patch of the comparison data set
•Δ: Displays the differential Lab color values for the reference and comparison data set
•ΔE(ab), ΔE(2000), ΔL*, Δa*, Δb*, ΔC or Δh: Displays the differential value of the reference and comparison data for the current patch, depending on what is set in the "Parameter" list
•"Ref. [XYZ]": Displays the XYZ color values for the current patch of the reference data set
•Cmp. (beside "Ref. [XYZ]"): Displays the XYZ color values for the current patch of the comparison data set
•Δ: Displays the differential XYZ values for the reference and comparison data set
•"Spectrum": Displays the spectral values for the current patch. An appropriate message displays if there are no spectral values.
•"Ref. [D]": Displays absolute or relative cyan, magenta, yellow, and black density values for the current patch.

Note: You set the density display (absolute or relative) in the "Preferences" dialog ("Measurement" tab).