
Click the "3D color space" tab to view a three-dimensional display of the test chart in the CIE L*a*b* or CIELAB color space.
3D display of the color space
This diagram shows a three-dimensional display of the color gamut in the L*a*b* color space.
This display is suited for comparing print and proof color spaces. For example, you can judge to what extent a proofer is capable of reproducing the colors of a printer.
The diagram shows the maximum color gamut of the color data of the measured test chart. If you wish, you can confine the result by profile settings, for example, by limiting the total dot area and/or maximum black or black width. The color gamut then diminishes in chromatic, dark colors.
Dirt on the test charts or measuring errors causes the color gamut to become uneven. You can then remedy this by smoothing the data.
Display
To the right of the diagram, you can define various settings for viewing the color gamut:
•You can select how the color gamut will be displayed in "Diagram":
·"Stacks": 3D display of the stacks (layers) of the color gamut, see Examples: 3D displays of the layers ('Stacks' diagram).
·"Sections": 2D display with sections through the color space, see Examples: 2D sections throughout the color space ('Sections' diagram).
•In the "Stacks" diagram, you can change the vertical position of the layers with the lightness slider (L). All of the color gamuts are shown if lightness is set to maximum (L=100). You remove layers as you gradually reduce lightness. The graduation depends on the ΔE setting.
•In the "Sections" diagram, you can view the 2D sections throughout the color space by moving the lightness slider (L).
•In the "Stacks" diagram, the "Elevation" and "Hue angle" sliders allow you to set the observer's viewpoint, and consequently, from which point you are looking at the color gamuts.
•In the "Stacks" diagram, you can use the "ΔE" slider to set the layer distance ΔE, that is the distance between the layers of the color gamuts.
•You can scale up or down the view as you wish with the "Zoom" slider.
•If the default is left as it is, the reference data set is blue in the diagram and the comparison data set is red. You can swap the colors or select "Black". For a better overview, you can also hide the data set concerned by selecting "None".
•The "Show wire model function" allows you to display the color gamut either as a full color or transparently as a wire model (see Examples: 'Show wire model' view).
•"Color space volume" shows the gamut volume for the reference and comparison data and the deviation in percent in both cases. This lets you check whether the gamut has increased or decreased.
Note: In the earlier versions of Quality Monitor, the influence of black in the color space that you viewed in the 3D graphic was only approximate. Now voxel algorithms make precise calculation possible and the influence of black that displays is exact.
Examples: 3D displays of the layers ('Stacks' diagram)
|
"Lightness (L)" slider |
||
|
L=100 
|
L=66 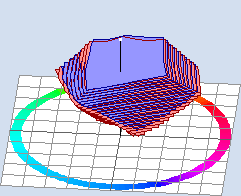
|
L=33 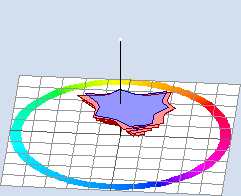
|
|
"ΔE" slider |
||
|
ΔE=2 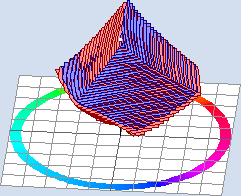
|
ΔE=5 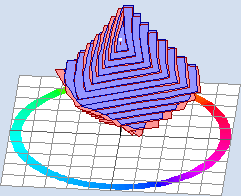
|
ΔE=10 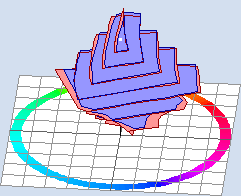
|
|
"Elevation (ele)" slider |
||
|
ele=30° 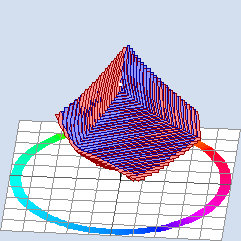
|
ele=60° 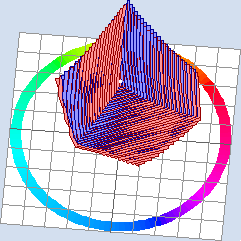
|
ele=90° 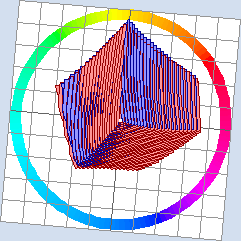
|
|
"Hue angle (hue)" slider |
||
|
hue=5° 
|
hue=180° 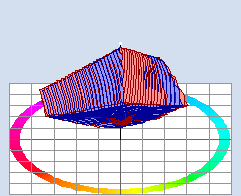
|
hue=270° 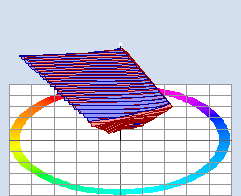
|
Examples: 2D sections throughout the color space ('Sections' diagram)

Note: You can only use the "Lightness" and "Zoom" sliders in this view.
|
"Lightness (L)" slider |
||
|
L=50 
|
L=65 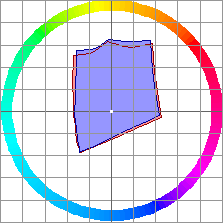
|
L=80 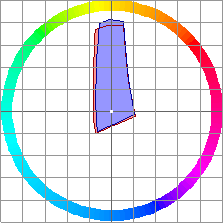
|
Examples: 'Show wire model' view
|
Default setting in the "Stacks" diagram •"Lightness (L=100)" slider •"Elevation (ele=30°)" slider •"Hue angle (hue=5°)" slider •"ΔE (ΔE=2)" slider |
|
|
Wire model unchecked 
|
Wire model checked 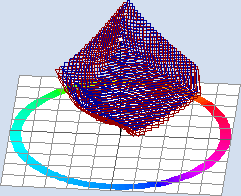
|
|
Default setting in the "Sections" diagram •"Lightness (L=50)" slider |
|
|
Wire model unchecked 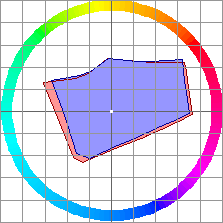
|
Wire model checked 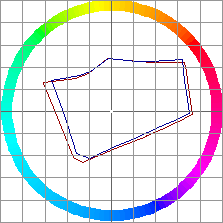
|