
3D display of the color space (with central projection and/or animation)
Click "3D color space" in the button bar to view a separate, three-dimensional display of the test chart in the CIE L*a*b* or CIELAB color space.
In contrast to the 2D/3D view that you can display with the tab, this function lets you switch to a central projection of the color space and/or also show it as an animated graphic. In addition, you can display different test charts, each in their own window, in this 3D view, allowing you to compare the color spaces directly with one another.
Note: This function uses the graphics card of your computer and, for that reason, depends on your hardware.
3D display of the color space
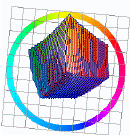
This diagram shows a three-dimensional display of the color gamut in the L*a*b* color space. This display is suited for comparing a print and proof color space. For example, you can judge to what extent a proofer is capable of reproducing the colors of a printer.
The diagram shows the maximum color gamut of the color data of the measured test chart. If you wish, you can confine the result by profile settings, for example, by limiting the total dot area and/or maximum black or black width. The color gamut then diminishes in chromatic, dark colors.
Dirt on the test charts or measuring errors causes the color gamut to become uneven. You can then remedy this by smoothing the data.
Display
To the right of the diagram, you can define various settings for viewing the color gamut:
•"Reference data", "Comparison data": If the default is left as it is, the reference data set is blue in the diagram and the comparison data set is red. You can swap the colors or select "Black". For a better overview, you can also hide the data set concerned by selecting "None".
•"Show wire model": Enabling this function allows you to display the color gamuts transparently as a wire model.
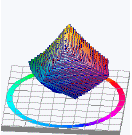
•"Sections": When you enable this function, you switch from a 3D display of the color space with stacks (layers) to a 2D display with sections through the color space.
·2D sections throughout the color space ("Sections" enabled, L=50)
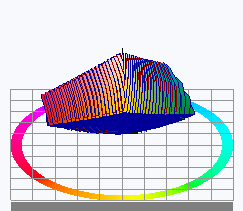
•"Central projection": You change the view to a parallel projection (like the view displayed in the "3D color space" tab) when you disable this function.
•"Animation": You start a rotation of the display around the lightness axis when you enable this function.
•"Lightness" slider: The effect depends on the "Sections" function.
·In the stacks diagram ("Sections" disabled), you can change the vertical position of the layer with the lightness slider (L). All of the color gamuts are shown if lightness is set to maximum (L=100). You remove layers as you gradually reduce lightness. The graduation depends on the ΔE setting.
·In the "Sections" diagram, you can view the 2D sections throughout the color space by moving the lightness slider (L).
•"Elevation" and "Hue angle" sliders: Use these sliders to set the observer's viewpoint, and consequently, from which point you are looking at the color gamuts/layers.
•"ΔE" slider: In the stacks view ("Sections" disabled), this slider lets you set the layer distance ΔE, that is the distance between the layers of the color gamuts.

Note: You can make the window bigger or smaller as you wish by dragging at the sides of the window with the mouse.
The following graphics show some examples of color gamuts in the color space.
Three different view are shown one below the other:
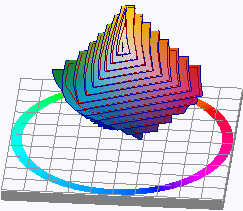
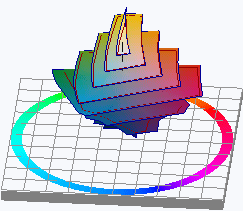
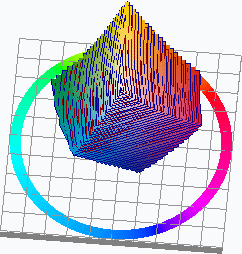
•Row 1: The "Central projection" function is enabled.
•Row 2: The "Central projection" function is disabled.
Only one slider setting at a time was changed to illustrate the effect of the four sliders. The following basic setting was used (left graphic in each case):
•"Lightness (L=100)" slider
•"Elevation (ele=30°)" slider
•"Hue angle (hue=5°)" slider
•"ΔE (ΔE=2)" slider
The changed slider setting is shown in each case.
|
"Lightness (L)" slider |
||
|
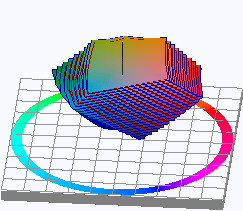
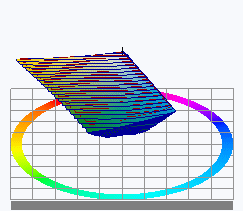
L=100 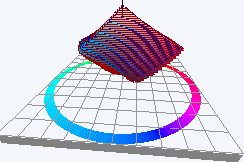
|
L=66 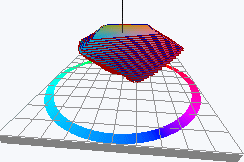
|
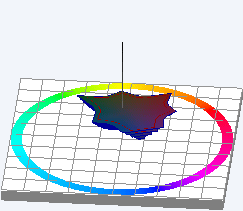
L=33 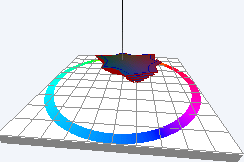
|
|
|
|
|
"ΔE" slider |
||
|
ΔE=2 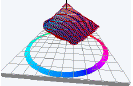
|
ΔE=5 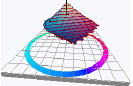
|
ΔE=10 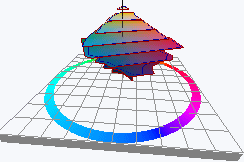
|

|
|
|
|
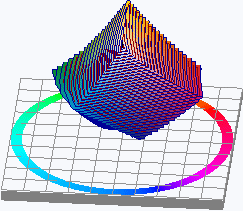
"Elevation (ele)" slider |
||
|
ele=30° 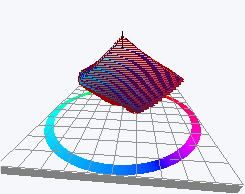
|
ele=60° 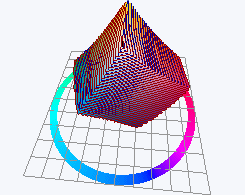
|
ele=90° 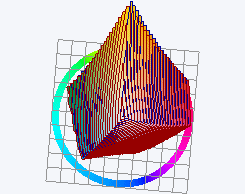
|
|
|
|
|
"Hue angle (hue)" slider |
||
|
hue=5° 
|
hue=180° 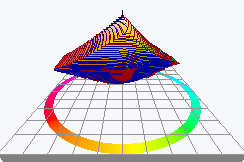
|
hue=270° 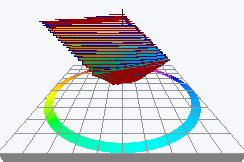
|

|
|
|
2D sections throughout the color space ("Sections" enabled, L=50)
|
Central projection disabled 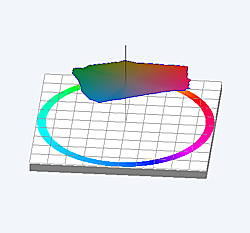
|
Central projection enabled 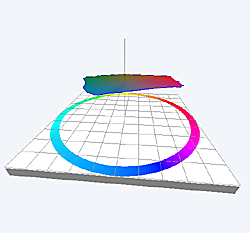
|
Central projection disabled 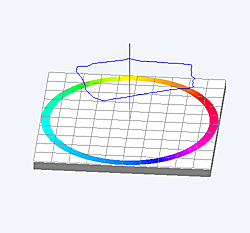
|