
A test chart showing the color data of the proof profile you wish to correct is displayed when you click the "Proof correction" tab.
Correction of proofer profile
This function lets you improve the proof result by making corrections to a proofer profile.
Note: In a proof correction, only the color conversion for "absolute colorimetric" Rendering Intent (i.e. a colorimetrically accurate reproduction) is changed.
The Lightness adaption for proof function also should not be enabled for paper white correction when setting the profile calculation options.
Measured color deviations between the print and proof are used for the automatic correction of the proofer profile.
This requires that you have the color data of a test chart of the printing process and the proof result in addition to the ICC profile for the proof. The test chart must be the same type and have quite an amount of color data.
We recommend a large test chart, for example:
•ISO 12642 / ANSI IT8.7/3
•ISO 12642-2 / ANSI IT8.7/4
•ISO 12642-2 / ECI 2002
A comparison of the color data between the print and proof shows the color differences, and an appropriate correction is automatically written to the proof to minimize the differences.
This procedure can be used several times (iterative), with the differences to be corrected becoming less with every step.

Note: In most cases, a first correction step is fully adequate, and the measured differences between print and proof are acceptable for proofing and color measurement.
The following steps are required for a proof correction:
1.The ICC profile and the color data of a test chart of the printing process are available.
2.The proof profile that simulates the printing process of the printed test chart on the proofer is generated.
3.With the print and proof profile, you output a proof using the test chart data of the printing process.
4.You then measure this proof.
You now have the three files you need for proof correction:
•1: the proof profile you will correct
•2: the color data of the test chart of the printing process (production process, usually ISOcoated_v2_ECI or ISOcoated_v2_300_ECI)
•3: the color data of the test chart of the first proof
To the right of the graphic, you will find control elements and display boxes that you can use to make subsequent corrections to the proof profile.
•"Measurement data from print": Button for opening the test chart data file for your printing process.
•"Measurement data from proof": Button for opening the test chart data file of the first proof (print simulation).
•"View": Check boxes for highlighting the differences in color in the two test chart data files. You can combine both functions (see also Procedure).
·"Enhance differences": The difference colors are scaled up threefold.
·"Miscolors": Shows the miscolors instead of the real colors.
•"Proofer profile correction": Paper white is kept in the proofer profile if you check this box.
•"Calculate": Button for starting calculation of the modified proofer profile.
•Field, Ref. [%], Ref [Lab], Cmp. [Lab], Delta: Move the mouse pointer to a patch to display the following values next to the graphic:
·Field: Displays the number (ID) of the current patch in the test chart
·Ref [%]: Displays cyan, magenta, yellow, and black screen percents for the current patch
·Ref [Lab]: Displays the Lab values for the current patch of the measurement data from print
·Cmp. [Lab]: Displays the Lab values for the current patch of the measurement data from proof
·Delta: Displays the ΔE, ΔL, Δa and Δb values for the current patch
1.Open the proof file you wish to correct.
(click "Open profile" in the button bar or with the "File > Open profile" menu).
2.Open the test chart for correction of the proof profile by clicking the "Proof correction" tab.
Any measured values saved in the proof profile are shown as color patches. However, you can also use other test chart types for calculation of the corrections.
3.Open the test chart file for your print process by clicking "Open... (Measurement data from print)".
4.Click "Open... (Measurement data from proof)" to open the test chart file of the first proof output (print simulation).

Note: The test chart type for the production process must be the same as that used for this proof.
The data are displayed as large and small color patches in the test chart file. You can make this clearer by checking the "Enhance differences" function. The difference colors are scaled up threefold so that it's easier for you to see the differences in colors.
You can see the differences even more clearly if you switch over to a display showing miscolors ("Miscolors" check box). These are used instead of the real colors to highlight slight differences in colors (especially grays). A color scale with a range of 0 to 12 shows the meaning of the colors. For example, the biggest differences (ΔE greater than or equal to 12) are red and the smallest blue. Differences lying in between this are orange, yellow or green.
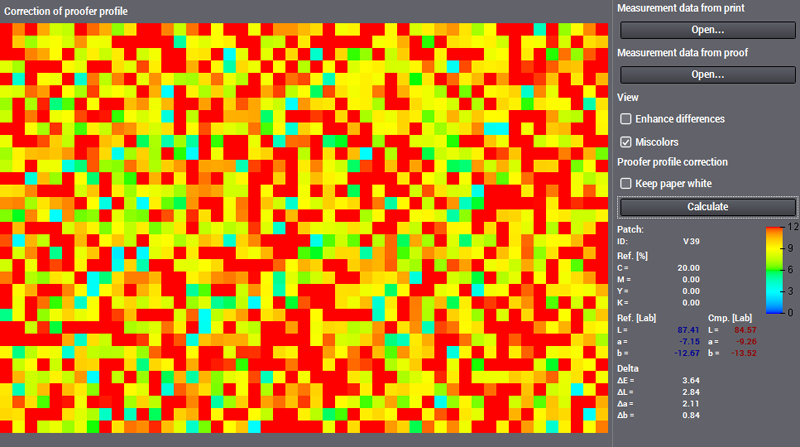
The miscolors view can also be scaled up threefold to be able to see the differences better. The scale range changes from 0 to 4 if you enable the "Enhance differences" option.
5.If you wish to keep paper white in the proofer profile, then check the relevant box (see also Notes on 'Keep paper white' option).
6.Start correction calculation by clicking "Calculate".
The application now calculates a modified proofer profile. Take note that the creation date and profile description are not yet changed by this action.
If you wish to change these inputs, you can type a new profile description in "Profile info." and then save the profile. This also updates the creation date.
7.Click "Save profile" (in the button bar) or select "File > Save profile" to open the "Save profile" dialog where you can save your modifications to the profiles (if necessary, use a different profile name and/or target folder).
Notes on 'Keep paper white' option
The table for "absolute colorimetric" conversion of Lab <> CMYK etc. is modified (B2A1 tag) during the proof profile iteration. If no constraints are specified, then all points in the table can be moved so that there is a closer match between the Lab values found in the proof and the target values.
The paper white reference point in the table can also change because color deviations can also occur in the paper white neighborhood of the proofer. This can be the only point without any color, i.e. in CMYK (0, 0, 0, 0). Although simulation of the target data improves on the whole, it is possible that after the first iteration the proofs no longer have any area without colors and consequently without any screening structures.
When enabled, the "Keep paper white" option prevents changes in the table point responsible for the proofer paper white and limits it in the neighborhood. The protected range extends downward to L=96.9 (relative). Only below that do corrections gradually appear and have full effect below L=90 (relative).
"Keep paper white" can be enabled if a satisfactory E (i.e. ΔE <1) is achieved in paper white simulation (offset -> proofer) after the first proof iteration. This avoids further corrections in paper white simulation to a large extent.