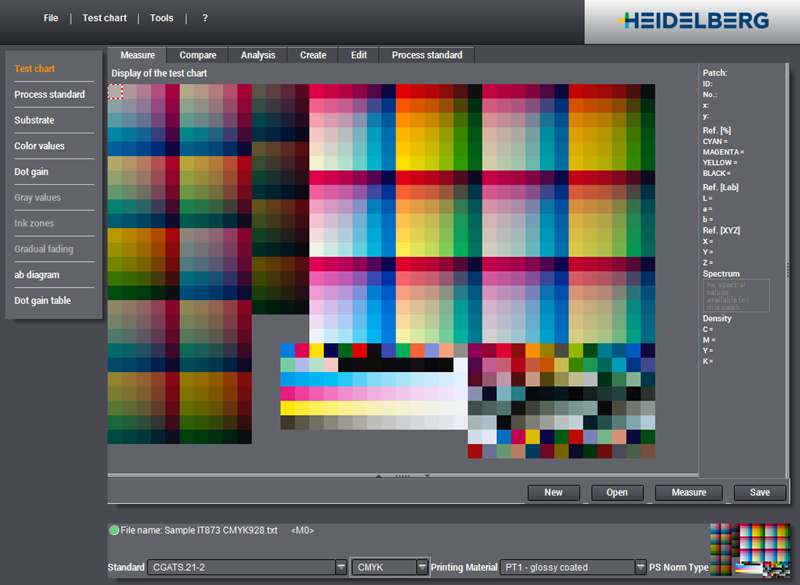
Display of the test chart
This view mode shows you the currently loaded test chart file and its patches. The number of patches in the palette depends of the type of test chart/control element.
The color patches are reproduced as precisely as possible on the monitor (depending on the color depth set for the monitor and the monitor calibration).
Field, Ref [%], Ref. [Lab], Ref. [XYZ], Spectrum, Density
The following information and reference values display beside the graphic when you move the mouse pointer to a patch or enable the patch with a click (the patch is highlighted by a red-and-white frame):

Note: If "COLOR_NAME" is specified in the color data file, this name appears at the top and is also written to the export file.
•"Field": Displays information about the current patch in the test chart or the control element
·"ID" = patch number, e.g. "N 18"
·"No." = patch number, e.g. "205"
·"x" = column number, e.g. "18"
·"y" = row number, e.g. "14"
•"Ref. [%]": Displays cyan, magenta, yellow, and black screen percents for the current patch.
•"Ref. [Lab]": Displays the Lab values for the current patch.
•"Ref. [XYZ]": Displays the XYZ values for the current patch.
•"Spectrum": Displays the spectral values for the current patch. An appropriate message displays if there are no spectral values.
•"Density": Displays absolute or relative cyan, magenta, yellow, and black density values for the current patch.

Note: You set the density display (absolute or relative) in the "Preferences" dialog ("Measurement" tab).