
CMYK test charts
'ISO 12642 / ANSI IT8.7/3' Test Chart with 928 Patches
Advantages
•Standardized ISO/ANSI test chart
•Optimized for offset printing and general application
•Many different combinations of black with CMY
•For special black calculations, e.g. PrintOpen 4.x for PC and Mac OS X
(not for Mac OS 9)
K: 20%, 40%, 60%, 80%
•Very good profile quality for prints and proofs
Disadvantages
•Problems with the distribution of ink because of the regular arrangement of patches
•CMY colors only 6 x 6 x 6
CMY: 0%, 10%, 20%, 40%, 70%, 100%
•CMY colors often not enough for high-end proofs
•Measuring 928 patches takes longer
Recommended for
•automatic measurements only
•profiling prints and proofs in general
The test chart is divided into 27 blocks with a total of 928 patches which are marked by a two-digit number (00 to 26). The name of each color patch is made up of:
•the two-digit block number (00 to 26)
•the letter referring to the row or column (A to max. N)
•the two-digit number for columns or rows (01 to max. 13)
|
Group |
Patches (928) |
Function |
|---|---|---|
|
00 |
7 (CMYK and RGB) |
Solids (primary and secondary colors) for measuring density |
|
00 |
10 |
Patches with CMY combinations with same amounts of 70%, 40% and 20% |
|
00 |
8 |
Patches with CMY combinations with same amounts of 100% |
|
00 |
1 |
Paper white |
|
00 |
4 x 13 = 52 |
C, M, Y and K step wedges for checking the dot gain |
|
00 |
43 |
Patches with CMY combinations of 20%, 40%, 70% and 100% |
|
00 |
37 |
Patches with neutral grays (CMYK) for checking the gray balance |
|
00 |
24 |
Patches with CMY combinations of 20%, 40%, 70% and 100% |
|
01 - 06 |
6 x 6 x 6 = 216 |
Saturated patches without black |
|
07 - 12 |
6 x 6 x 6 = 216 |
Saturated patches with 20% black |
|
13 - 22 |
10 x 5 x 5 = 250 |
Patches for checking the shadows |
|
23 - 26 |
4 x 4 x 4 = 64 |
Patches with a lot of color for checking the dot gain |
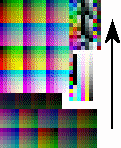
•If possible, print the test chart in the recommended direction (direction of arrow).
•The regular arrangement of the patches causes the ink to be distributed unevenly over the areas. You can eliminate this problem either by
·printing the "ISO 12642 / ANSI IT8.7/3 Visual" test chart once in longitudinal direction and once in cross direction and then using the mean values or by
·using the "ISO 12642 / ANSI IT8.7/3 Random" test chart.