Color calculator > Compare color values
The values for spot colors depend on the printing material on which they are printed. In addition, deviations between the various batches can occur because of the production process. "Compare color values" lets you compare the color values of patches with the table entries.
1.Measure the hue you wish to analyze.
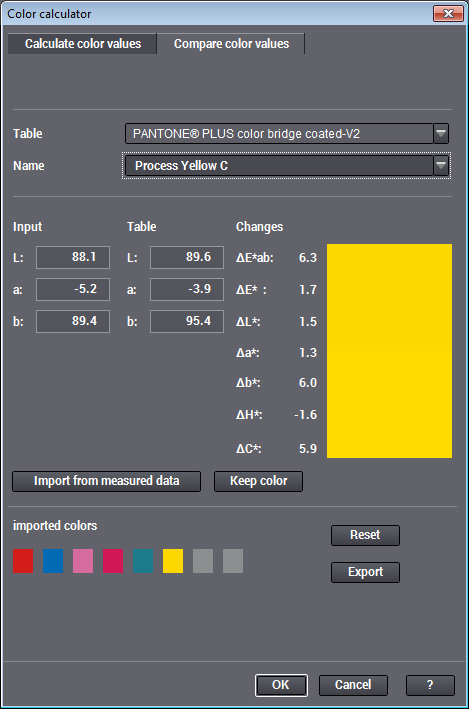
2.Start the color calculator with "Tools > Color calculator" and select the "Compare color values" tab.
3.In "Table" select the spot color table used that you want for comparison.
4.Click "Import from measured data". The Lab value of the selected patch is imported to the color calculator (Lab values displayed below "Input").
The color calculator now automatically looks for the color in the table that best matches the imported values (Lab values displayed below "Table").
(5).Select the correct color name if the item you want was not found in the color table (because, for example, the deviation is greater than the distances between the table colors).
The two Lab values are now compared by the color calculator and the deviations display in "ΔEab" and "ΔE00" below ""Changes". In addition, the differences for single channel, chroma and saturation display as well.
These values let you evaluate how close the actual print result of the spot color on the printing material comes up to the matching value in the table.
In the field, deviations of approx. 1 for ΔE00 can be classified as satisfactory, and values below 3 as still within the ISO standard. The spot color probably cannot be used with ΔE00 values of 5 thru 6 or higher.
You can also use "Compare color values" to compare two colors without using the color table. To do this, simply enter the Lab values of the second color in the boxes below "Table".
To compare several color patches of a measure run, click the next color patch in the test chart, click "Import from measured data" again and analyze the next color.

Note: The other setting options are described in Color calculator > Calculate color values.
The current comparison is buffered when you click "Keep color". In this way, you can import as many as eight colors from measured data or define them by entering values and compare the color data with the color table.
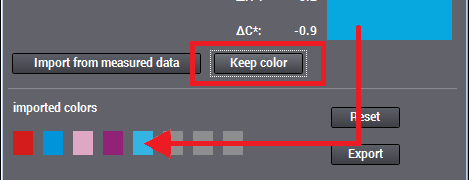
Afterwards, you can save the data to a csv file using the Export function. The table in the csv file then contains the patch name, the related Lab values from "Input" and "Table" and the deviation ΔE00.
Click "Reset" to clear the buffer without exporting the data.