
General Information about Printing
Color Toolbox calculates quality characteristic values, e.g. statistical parameters from ΔE (Delta E) evaluations, based on a comparison of color data sets. The results are shown in different lists and diagrams in an easy-to-understand way and can also be printed as a record. This lets you create quality reports, for example, as are required for certified businesses.
You can call up the print dialog in all the main functions with "File > Print". The "Print" dialog appears where you can select the diagrams and tables you wish to print by checking the appropriate boxes. In addition, you can define settings relating to the job (job name and number, sheet number and comment).
Note: You can select "Label printer (Dymo LabelWriter)" only in the "Measure" main function (see also Labels to be printed ).
You can print various diagrams and tables or labels with this dialog. The diagrams you can select and their contents depend on the main function you are in when you call up the print function. After you selected your diagrams and clicked "OK", a print preview is generated and displays everything you selected (diagrams, data tables, reports and logs) one below the other, if necessary, on several pages.
The lower border of the print preview displays the current page number and total number of pages.
Depending on what you have selected and on your printer, you can print the diagrams and tables to paper or archive them to a file using the "Print" button (at the bottom right). You can generate a PDF file with "Adobe PDF" if you have a suitable application like Adobe Acrobat.
The arrows at the top left of the preview let you scroll to the next or previous pages or go to the first or last page.
You can set the view of the print preview at the top right: whole page or just a section, scale up or down using the magnifying glasses or select a default factor from the list.
The print function is available only if you loaded at least one color data file or profile. Quality results from comparisons (e.g. reports) are printed with empty templates if reference and comparison data are not open at the same time. The data of the open file are listed in the relevant table.
Diagrams to be printed
The following table shows you which diagrams and tables can be printed in each of the six main functions:
|
Print Diagrams/Tables |
Measure |
Compare |
Analysis |
Create |
Edit |
Process standard |
|---|---|---|---|---|---|---|
|
Color quality certificate |
|
|
– |
|
– |
– |
|
Process standard |
|
– |
– |
|
– |
|
|
Dot gain report |
|
|
– |
|
– |
– |
|
Ink Zones |
|
– |
– |
– |
– |
– |
|
Gradual fading |
|
– |
– |
– |
– |
– |
|
xy diagram |
– |
|
– |
|
– |
– |
|
ab diagram |
– |
|
– |
|
– |
– |
|
La/Lb diagram |
– |
|
– |
|
– |
– |
|
ΔLab Report |
– |
|
– |
– |
– |
– |
|
CIE Report |
– |
|
– |
– |
– |
– |
|
Proof report |
|
- |
– |
– |
– |
– |
|
Statistical results |
– |
|
– |
– |
– |
– |
|
Data table |
|
|
– |
|
– |
– |
|
Profile parameters |
– |
– |
– |
– |
– |
– |
|
Analysis report |
– |
– |
|
– |
– |
– |
|
Production check conform with ISO 12647-2 |
– |
– |
|
– |
– |
– |
Please note the following items:
•Some diagrams can only be printed if the relevant data are loaded.
•You can print some diagrams and tables in "Compare" if two color data sets or two ICC profiles are open, in "Analysis" if a series is open.
•You can only print the xy, ab and La/Lb diagrams and data tables if you have measured data.
Select the diagrams and tables you want to print by checking the appropriate boxes. All selectable diagrams and tables are enabled automatically if you selected "Color quality certificate". A flyleaf is also generated with the following details:
•a graphic of the test chart or test strip used
•the names of the loaded files
•process standard used and paper grade
•the measuring method
•the job/customer

Note: Take note of the number of pages that will be printed for the color quality certificate or data table. For example, more than 40 A4 pages are required to print all the color data of a large test chart.
Job number, Job name, Sheet number and Comment
You can assign every diagram and table a job number, a job name, a sheet number (if present) and any comment that will also be printed. Check the appropriate boxes and type in your text.
You can also check the boxes and not type anything if you want line spacing that you can later fill out by hand.
If a DYMO LabelWriter is connected, you can print a proof report to labels that you can then use to mark your proofs. You can select "Label printer (Dymo LabelWriter)" only in the "Measure" main function. This requires that a proof process standard is set. The "Proof report" option must be selected in the print dialog.

Note: Always install the latest driver for the DYMO LabelWriter for printing your data.
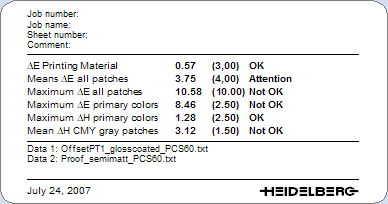
You can print the diagrams and data tables with the HEIDELBERG logo at the bottom right margin.
Example:
You can also print the pages without this logo or with a custom logo.
Proceed as follows:
1.Create a "gif", "jpg" or "png" file that has the logo you want.
The optimal width-to-height ratio for the logo is 60:5.
2.Name this file "ReportImage.png" (.jpg or .png). This file name is case-sensitive. "R" and "I" must be upper case.
3.Copy the file to this location:
"<Drive>:\Prinect Color Toolbox\Color Tool xx.0\settings\preference"
The logo you set will be printed the next time instead of the HEIDELBERG logo. The image is scaled automatically.

Note: The HEIDELBERG logo displays if the image cannot be loaded. There is no error message. Create a file with a white background if you do not want a logo.


