
'ISO 12642-2 / ECI 2002 Visual' Test Chart with 1485 Patches
Advantages
•New test chart as an extension of ISO 12642 / ANSI IT8.7/3
•Contains the patches of ISO 12642 / ANSI IT8.7/3
•Contains the CMY patches of PrintOpen Extended
•Many different combinations of black with CMY
•For special black calculations, e.g. PrintOpen 4.0.5.2 for PC and Mac OS X
(not for Mac OS 9)
K: 20%, 40%, 60%, 80%
•Very finely stepped CMY patches 9 x 9 x 9
CMY: 0%, 10%, 20%, 30%, 40%, 55%, 70%, 85%, 100%
•Contains special patches with combinations of 3% and 7% for packaging printing
•Specially for high-end proofs
•Very good profile quality for prints and proofs
Disadvantages
•Problems with the distribution of ink because of the regular arrangement of patches
•Measuring 1485 patches takes longer
Recommended for
•automatic measurements only
•profiling prints and proofs in general
The new "ISO 12642-2 / ECI 2002 Visual" or "Random" test chart was developed by an ECI workgroup in cooperation with Heidelberger Druckmaschinen AG. They are a superset of the present "ISO 12642 / ANSI IT8/7.3" test chart. All 928 patches of this test chart are found in the 1485 patches of the new "ISO 12642-2 / ECI 2002". It also contains the CMY patches of PrintOpen Extended 840.
Like the "ISO 12642 / ANSI IT8/7.3" test chart, "ISO 12642-2 / ECI 2002 Visual" comprises several blocks with a total of 1485 patches that can be grouped as follows:
|
Group |
Patches (1485) |
Function |
|---|---|---|
|
1 |
9 x 9 x 9 = 729 |
Patches without black in CMY combinations 0%, 10%, 20%, 30%, 40%, 55%, 70%, 85% and 100%. |
|
2 |
6 x 6 x 6 = 216 |
Patches with 20% black in CMY combinations 0%, 10%, 20%, 40%, 70% and 100%. |
|
3 |
5 x 5 x 5 = 125 |
Patches with 40% black in CMY combinations 0%, 20%, 40%, 70% and 100%. |
|
4 |
5 x 5 x 5 = 125 |
Patches with 60% black in CMY combinations 0%, 20%, 40%, 70% and 100%. |
|
5 |
4 x 4 x 4 = 64 |
Patches with 80% black in CMY combinations 0%, 40%, 70% and 100%. |
|
6 |
3 x 3 x 3 = 27 |
Patches with 100% black in CMY combinations 0%, 40%, 70% and 100%. |
|
7 |
4 x 20 = 80 |
C, M, Y and K step wedges at 100%, 98%, 95%, 90%, 85%, 80%, 75%, 70%, 60%, 50%, 40%, 30%, 25%, 20%, 15%, 10%, 7%, 5%, 3% and 2% |
|
8 |
1 |
Patch with paper white |
|
9 |
37 |
Patches with neutral grays (CMY) and black overprint at 0%, 10%, 20%, 40%, 60%, 80% and 100%. |
|
10 |
9 |
Patches with primary colors and 70% black (compatible with ISO 12642) |
|
11 |
11 |
Patches with all CMY combinations of 0% and 3% (without repeats from group 1 thru 7) |
|
12 |
11 |
Patches with all CMY combinations of 0% and 7% (without repeats from group 1 thru 7) |
|
13 |
50 |
Patches with all CMY combinations of 0%, 3% and 40% (without repeats from group 1 thru 7 and 11 thru 12) |
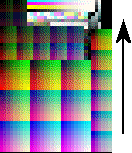
•If possible, print the test chart in the recommended direction (direction of arrow).
•The regular arrangement of the patches causes the ink to be distributed unevenly over the areas. You can eliminate this problem either by
·printing the "ISO 12642-2 / ECI 2002 Visual" test chart once in longitudinal direction and once in cross direction and then using the mean values or by
·using the "ISO 12642-2 / ECI 2002 Random" test chart.