Recommendation: To reduce errors caused by fluctuating temperatures, you should print at least 200 sheets so that the machine runs at operating temperature before you print the test charts.
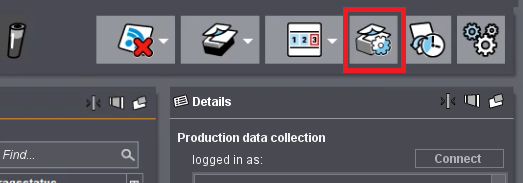
1.In the Digital Printing Terminal, start the Digital Engine Manager.
2.Click "New" in "ICC Profile".
3.Select the paper for which you want to create an ICC profile and the measuring device you will use.
4.If required, you can also set the screen system that you usually use.
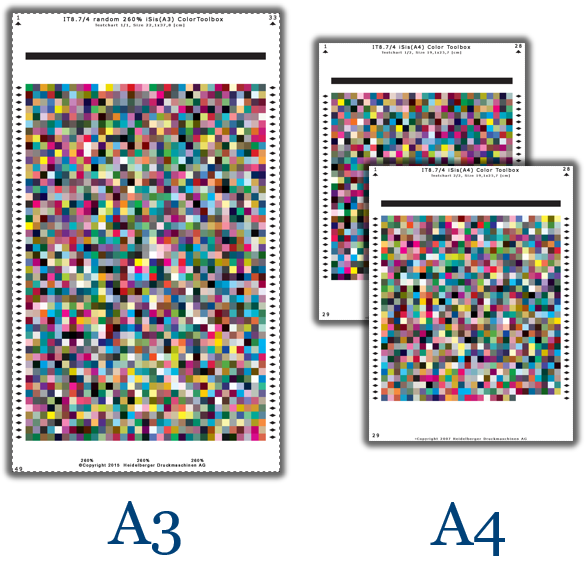
Two different IT8.7/4 test charts are available, depending on the paper size:
•For papers of at least A3 size, you can use the A3 test chart made up of one sheet.
•For papers of at least A4 size but smaller than A3, you can use the test chart made up of two sheets.
6.Select the output tray for the printed test charts and the number of copies.

Note: We recommend printing at least 15 copies and then measuring the last of the printouts.
7.Click "Print". The test charts are output on the machine.
Measure the printed test page(s) with a colorimeter (see Measuring Devices for Measuring Test Pages).
8.In the Digital Engine Manager, click "Measure" and then "Calibrate Measuring Device".
9.After the measuring device is calibrated, click "Measure".

Note: With the two-page A4 test chart, you must make sure to measure "Page 1" first. Only one page is measured with A3 test charts. In any case, make sure that the page is correctly oriented when it enters the measuring device.
10.Measure the test chart with the colorimeter.
After it is measured, the measurement result displays in the preview. With two-page A4 test charts, the first page displays on the left and you are prompted to insert the second page into the measuring device.
11.Measure page 2 in this case.
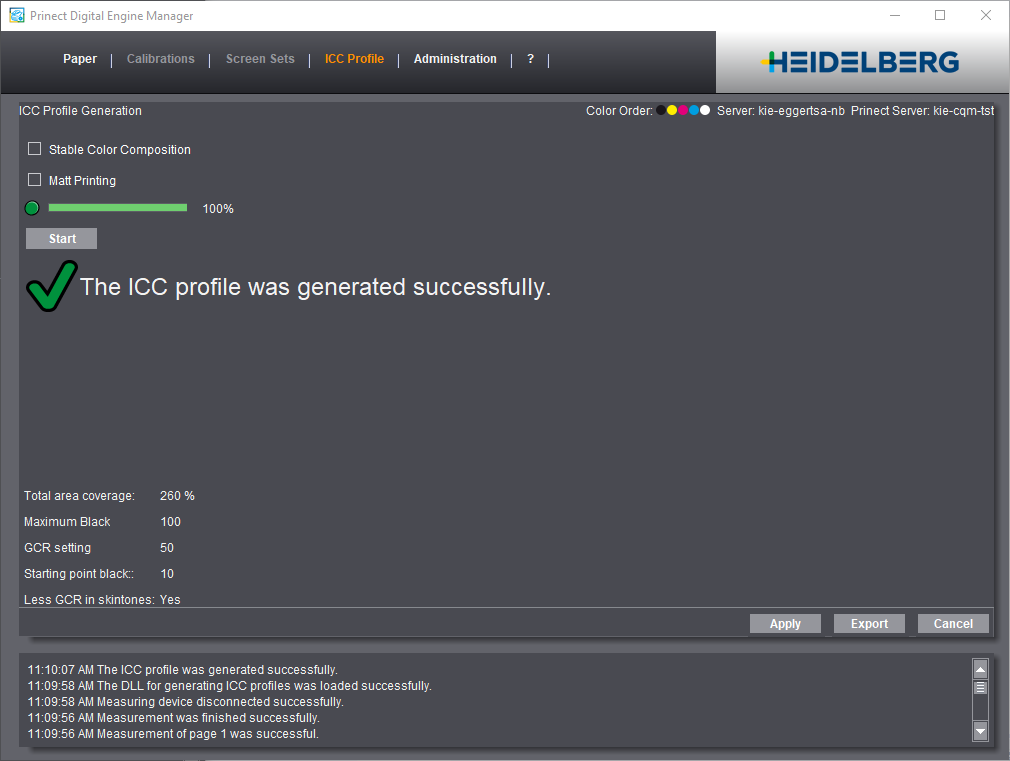
12.When the measurement result displays fully in the preview, click "Next". The ICC profile can now be calculated on the basis of the measured data.
To make it easier to create the profiles, the ICC profiles are calculated with defaults optimized for the Versafire. However, if required, you can select whether you want a more stable color composition or a printout that is more matte. With "Stable Color Composition", the values for the GCR (Gray Component Replacement) are increased, with "Matt Printing" the values for total area coverage (TAC) are lowered.
We recommend calculating the profile with the defaults.
(13).If needed, enable one or both options.
•The "Stable Color Composition" option increases the "GCR" to 80, that is, the replacement of the chromatic process colors. Less color is needed to create a specific hue, i.e., the gray axis becomes more stable.
•Select "Matt Printing" if you want the printout to be more matte.
Maximum inking is reduced to 220% and possible glossy effects are avoided.
14.Click "Start" to calculate the ICC profile.
(15).You can also export the new ICC profile you created, for example, to save it in the file system or import it to another machine. However, you can also do this at any time later from the list of ICC profiles. At this point, it is also possible to generate various versions with different settings through the export.
16.Finally, click "Apply". The profile appears in the list of the ICC profiles.
Explanatory notes on the settings
•"GCR": The "Gray Component Replacement" function makes it possible for the gray component of the chromatic printing inks to be replaced by the black process color with an effect in the entire color space. The amount replaced can be set as desired. The color impression remains the same.
Less color is needed to create a specific hue, i.e., the dot area is reduced. The gray axis becomes more stable through the increased use of black. Since fewer chromatic colors are used, costs can be reduced. However, screen rosettes may be more noticeable under certain circumstances.
•"TAC" = Total Area Coverage: Maximum permitted area coverage, total inking
Total inking is calculated from the sum of the percentages of the color components. Depending on the print process and printing material, total area coverage can be less than the purely computational sum of the single colors.