
This shows you graphic charts of the time elapsed for speed and production counter for the previously selected machine and the defined period.
Note: The diagrams are available only for a maximum of 48 hours.
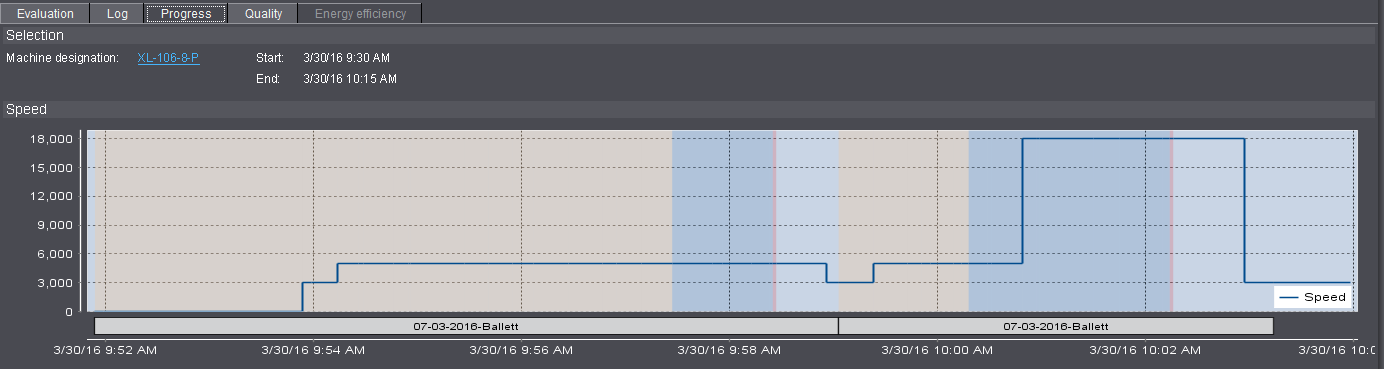
Speed
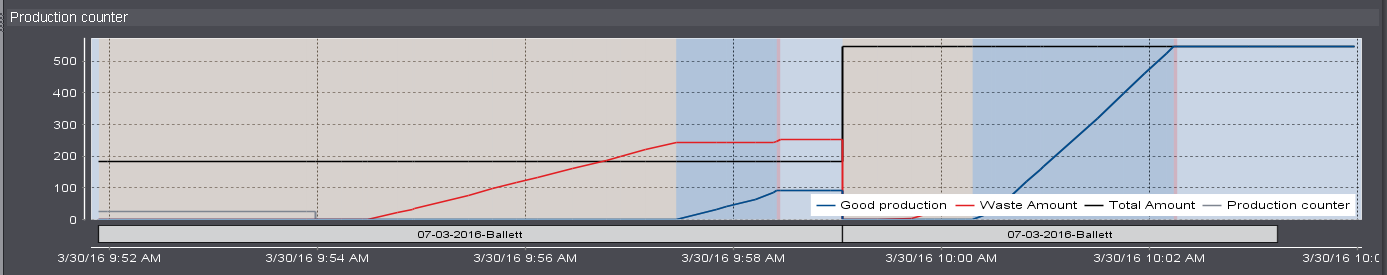
Production Counter
All graphic charts were already described in detail in the Operation progression. The only difference is that only the graphic charts of one operation are shown for the operation progression and the graphic chart for all operations in a certain period is shown for the shift progression.

Note: No speed graph is shown for machines which are connected via the Data Terminal and for digital presses.