Privacy Policy | Imprint | Prinect Know How | Prinect Release Notes ![]()
Right clicking one or multiple selected colors opens a context menu. Most of the functions of the context menu are identical to the functions in the list boxes for the individual table columns. See Table columns.
There are more context menu commands for spot colors:
Menu command | Function |
|---|---|
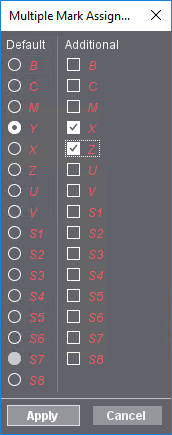
Multiple Mark Assignment | Prerequisite: To be able to use the multiple mark assignment, you must enable the "User-defined" + "global" combination of options. See Global. The multiple mark assignment lets you assign the selected spot color to multiple mark types at the same time. For this purpose, open the "Multiple mark assignment" window.
Here you can select the mark type to which the selected special color is to be assigned as the default mark color under "Standard". Under "Additional", you can assign the same mark color to other mark types. |
Color measuring | This function allows you to add new spot colors to the job by measuring a color sample with a colorimeter. The "Measure color" window opens. To record new spot colors, you need a colorimeter connected to your computer ("X-Rite EyeOne" or "X-Rite eXact"). The measured color is added to the job. See Adding a New Color by Measuring with the Colorimeter. After the colors are measured, the L*a*b* values are applied to the table columns and any existing CMYK values are deleted. If necessary, the "Source" column changes to "Job" and the "ND" (neutral density) column has a value calculated from the new L*a*b* values. Note: The "Export" function allows you to transfer measured spot colors to one of the custom spot color tables in the color library. These colors are then available throughout the local system environment. See Export spot colors or see "Color Library". |
Button bar at bottom
Button | Function |
|---|---|
New Color | To create a new color, a new line is inserted in the list of colors. You complete the definition of the new color by filling in the color parameters with the appropriate details. See Create a new color. |
Import Colors | The "Import colors" window opens to import colors from the spot color tables available in the color library into the job. See "Import Colors" Window. |
Export Colors | This function allows you to export colors that already exist in the job to one of the custom spot color tables in the color library. See Export spot colors and "Export Colors to User-Defined Color Table" Window. |
Privacy Policy | Imprint | Prinect Know How | Prinect Release Notes